
- Moving the markets
The futures markets got rattled early on by comments from China’s top banking regulator jawboning that “he’s very worried about risks emerging from bubbles in global financial markets and the nation’s property sector.”
That’s all it took to put the fears of further tightening, aka higher interest rates and bond yields, on the front burner with the effect that traders again started worrying about too much exposure to risk assets (stocks). And suddenly, yesterday’s warm and fuzzy feelings were gone, as no follow-through buying materialized.
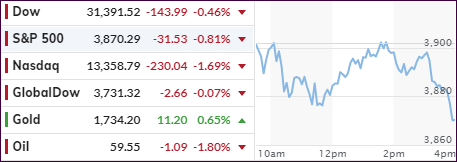
As a result, the regular trading session started with a drop below the unchanged line, and despite various attempts to push the major indexes into the green, all efforts failed. In fact, the dive into the close and to the lows of the day does not indicate much confidence.
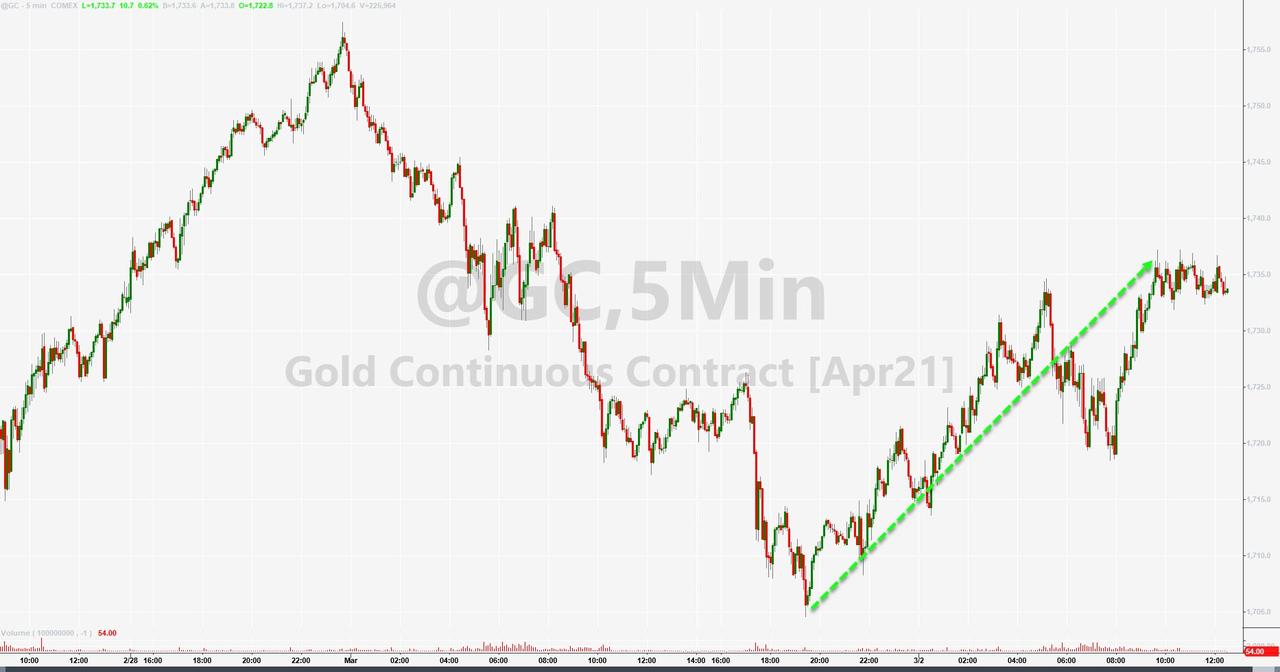
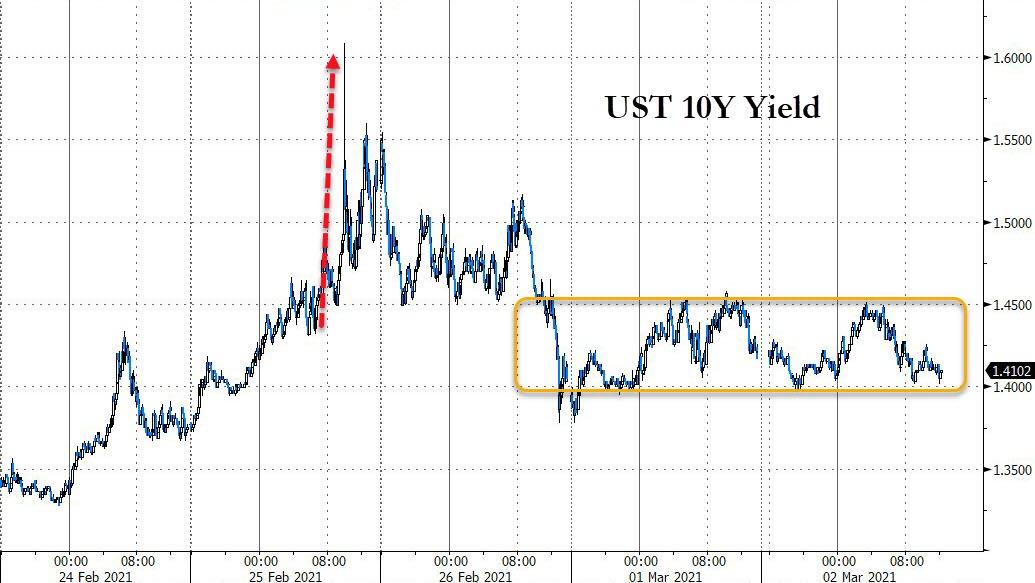
The Nasdaq, after being the leader in yesterday’s comeback fest, fared the worst and surrendered more than half of yesterday’s gains. Portfolio wise, Gold saved the day and ended up +0.57%, thanks to drops in the US Dollar and 10-year bond yields, which dipped below 1.41%.
Added CNBC:
Still, some investors believe it’s inevitable that yields will trend higher this year amid an economic recovery and potentially more fiscal stimulus, which could shrink stock multiples.
Another gigantic short-squeeze put the hurt on a “hedge fund VIP”, the damage of which is still unknown but rumors of liquidation abound. Look at this chart and imagine that you had a leveraged short position. Ouch!
Here again, when hedge funds are squeezed, and are forced to liquidate even their most favorite assets to raise cash to meet margin calls, early weakness in the markets can accelerate as it did today.
It’ll be interesting to see if there is more fallout to come, such as we’ve seen with the recent GME debacle.
2. ETFs in the Spotlight
In case you missed the announcement and description of this section, you can read it here again.
It features some of the 10 broadly diversified domestic and sector ETFs from my HighVolume list as posted every Saturday. Furthermore, they are screened for the lowest MaxDD% number meaning they have been showing better resistance to temporary sell offs than all others over the past year.
The below table simply demonstrates the magnitude with which these ETFs are fluctuating above or below their respective individual trend lines (%+/-M/A). A break below, represented by a negative number, shows weakness, while a break above, represented by a positive percentage, shows strength.
For hundreds of ETF choices, be sure to reference Thursday’s StatSheet.
For this current domestic “Buy” cycle, here’s how some our candidates have fared:
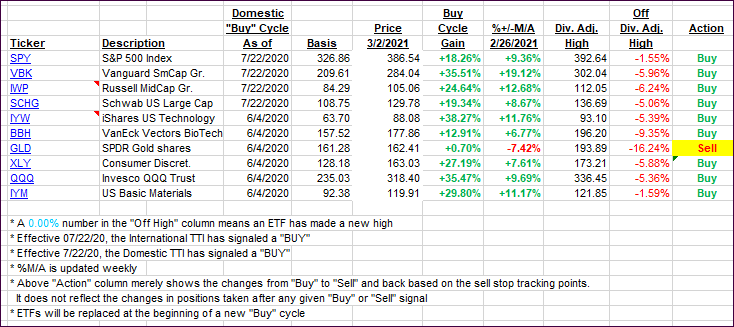
Click image to enlarge.
Again, the %+/-M/A column above shows the position of the various ETFs in relation to their respective long-term trend lines, while the trailing sell stops are being tracked in the “Off High” column. The “Action” column will signal a “Sell” once the -8% point has been taken out in the “Off High” column. For more volatile sector ETFs, the trigger point is -10%.
3. Trend Tracking Indexes (TTIs)
Our TTIs dipped with the International one showing more resistance to the sell off.
This is how we closed 3/2/2021:
Domestic TTI: +17.73% above its M/A (prior close +18.32%)—Buy signal effective 07/22/2020.
International TTI: +16.81% above its M/A (prior close +16.84%)—Buy signals effective 07/22/2020.
Disclosure: I am obliged to inform you that I, as well as my advisory clients, own some of the ETFs listed in the above table. Furthermore, they do not represent a specific investment recommendation for you, they merely show which ETFs from the universe I track are falling within the specified guidelines.
Contact Ulli