
ETF Tracker StatSheet
You can view the latest version here.
GLIDING INTO THE WEEKEND
- Moving the markets
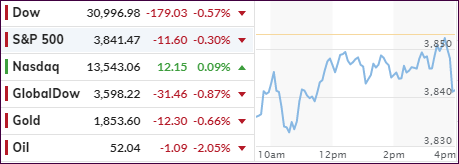
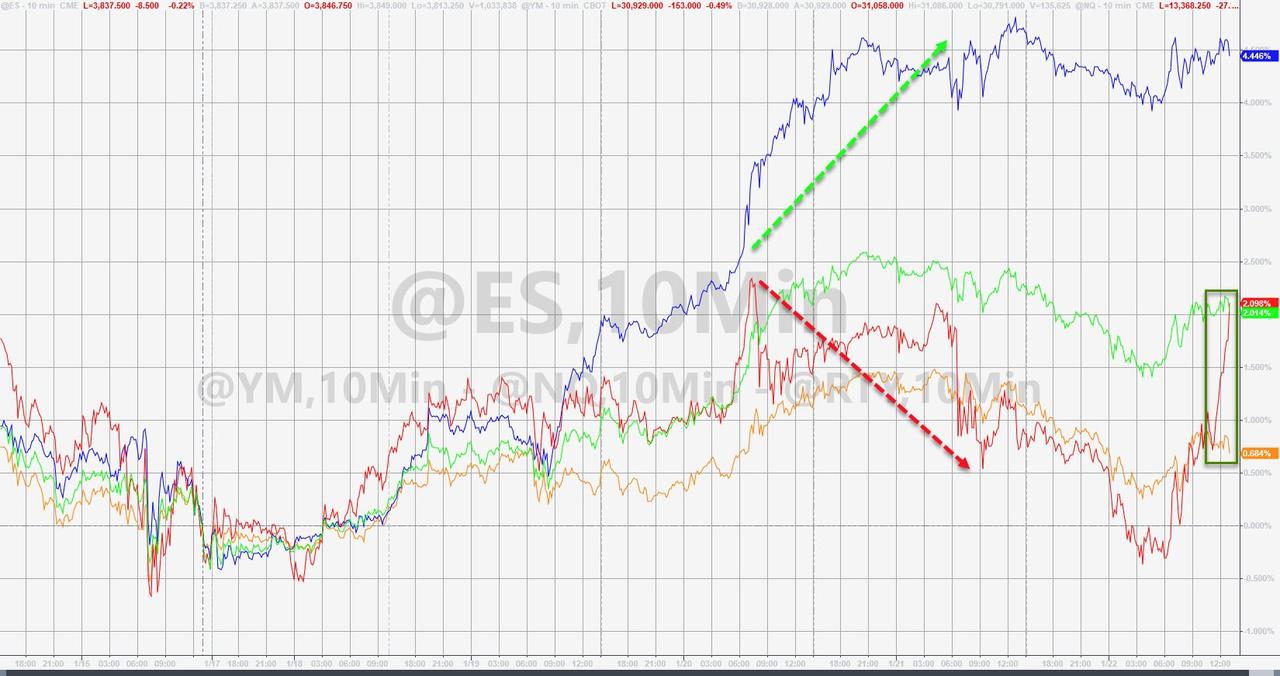
The futures already gave a preview of how the regular session might turn out, as the stimulus driven rally was overpowered by news of tighter and extended coronavirus restrictions, which would have adverse economic effects.
On the other hand, after a week solid gains, any excuse was welcome for traders to take some money off the table causing the major indexes, except for the Nasdaq, to slide into the weekend.
For the week, the Nasdaq rocketed +4.2% higher, while the Dow and S&P 500 added +0.6% and +1.9% respectively. SmallCaps (IWO) joined the rally by gaining +2.00%, but growth stocks and big tech names ruled.
In terms of more stimulus, opinions and viewpoints do not always align, as CNBC pointed out:
A growing number of Republicans have expressed doubts over the need for another stimulus bill, especially one with a price tag of $1.9 trillion proposed by Biden. Meanwhile, Democratic Sen. Joe Manchin has criticized the size of the latest round of proposed stimulus checks. Dissent from either party carries weight for Biden, who took office with a slim majority in Congress.
Be that as it may, it’s a foregone conclusion in my mind that stimulus plans of enormous magnitude are on deck, and it’s just a matter of time until they make their presence felt, which will have a negative effect on current low bond yields.
Michael Maharrey from Schiff Gold posted this question:
Why are interest rates at record lows?
The reason is simple; the Federal Reserve is artificially keeping them there.
The Process:
When Uncle Sam borrows money, it puts upward pressure on interest rates. The more bonds the Treasury Department issues, the lower the price falls because market demand can’t keep up with supply. Bond yields inversely correlate with bond prices. As the price of bonds drops, interest rates rise. This is simple economic calculus.
Enter the Federal Reserve. The Fed buys bonds on the open market (quantitative easing), creating artificial demand and propping prices up. This keeps interest rates artificially low.
So far, so good. But there is a small hitch in this process. The Fed buys these bonds with money created out of thin air and injects this money into the economy. This is inflation. And it’s precisely why the money supply increased at a record pace in 2020.
And this is exactly why I believe that every investor needs to have an allocation to Gold in his portfolio. It may not matter now, but the time will come, when it suddenly does.
2. ETFs in the Spotlight
In case you missed the announcement and description of this section, you can read it here again.
It features some of the 10 broadly diversified domestic and sector ETFs from my HighVolume list as posted every Saturday. Furthermore, they are screened for the lowest MaxDD% number meaning they have been showing better resistance to temporary sell offs than all others over the past year.
The below table simply demonstrates the magnitude with which these ETFs are fluctuating above or below their respective individual trend lines (%+/-M/A). A break below, represented by a negative number, shows weakness, while a break above, represented by a positive percentage, shows strength.
For hundreds of ETF choices, be sure to reference Thursday’s StatSheet.
For this current domestic “Buy” cycle, here’s how some our candidates have fared:
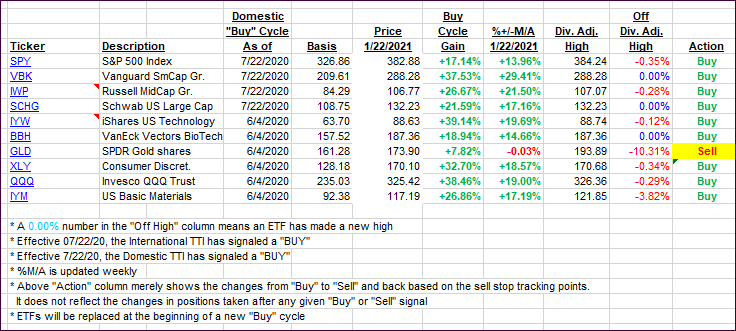
Click image to enlarge.
Again, the %+/-M/A column above shows the position of the various ETFs in relation to their respective long-term trend lines, while the trailing sell stops are being tracked in the “Off High” column. The “Action” column will signal a “Sell” once the -8% point has been taken out in the “Off High” column. For more volatile sector ETFs, the trigger point is -10%.
3. Trend Tracking Indexes (TTIs)
Our TTIs headed south as we saw a mixed close after today’s trading session.
This is how we closed 1/22/2021:
Domestic TTI: +18.37% above its M/A (prior close +20.01%)—Buy signal effective 07/22/2020.
International TTI: +17.33% above its M/A (prior close +19.42%)—Buy signal effective 07/22/2020.
Disclosure: I am obliged to inform you that I, as well as my advisory clients, own some of the ETFs listed in the above table. Furthermore, they do not represent a specific investment recommendation for you, they merely show which ETFs from the universe I track are falling within the specified guidelines.
———————————————————-
WOULD YOU LIKE TO HAVE YOUR INVESTMENTS PROFESSIONALLY MANAGED?
Do you have the time to follow our investment plans yourself? If you are a busy professional who would like to have his portfolio managed using our methodology, please contact me directly or get more details here.
———————————————————
Back issues of the ETF Tracker are available on the web.
Contact Ulli