
- Moving the markets
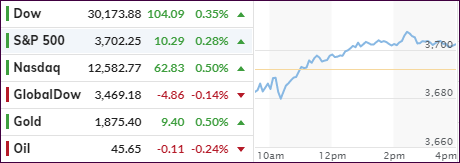
Despite the major indexes showing early weakness, as optimism about a quick passing of the fiscal stimulus bill vanished, equities ended up finding some support. That level served as springboard for a nice mid-day rally, which kept the indexes in the green. As has been the case lately, and today was no exception, the usual short squeeze lent a big hand in today’s ramp.
The Nasdaq was the leader with a moderate +0.50% gain, which looked downright puny when compared to the chest pounding +1.75% advance of the SmallCap Growth ETF IWO, which we have exposure to.
With the stimulus bill being in limbo, traders focused on Pfizer’s vaccine rollout in the U.K., which sparked hopes of a faster economic recovery in the future with 20 million doses having been ordered.
As stocks were gaining, so did bonds, with yields dropping thereby supporting gold. The US Dollar had no impact on the precious metals sector, as it hacked around aimlessly.
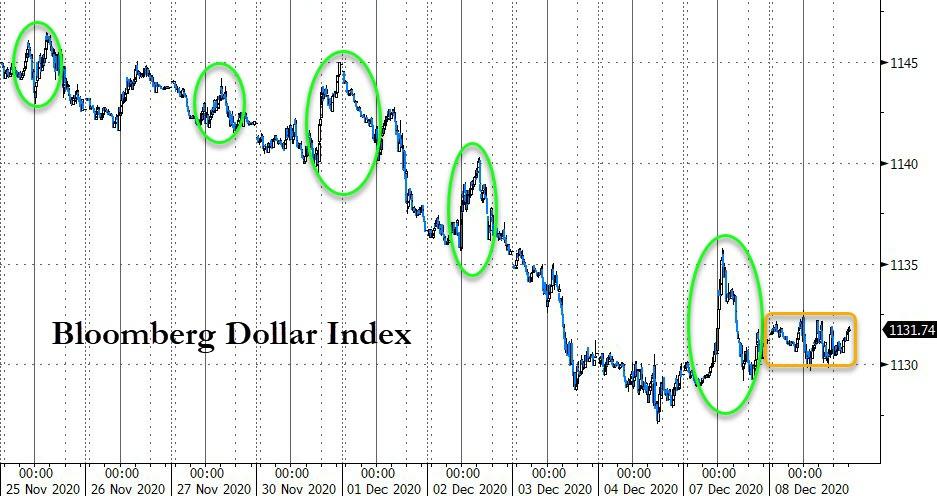
With all that bullishness, it’s still concerning to me that smart money is not participating in this “ramp-a-thon,” as Bloomberg demonstrates with this chart:

For sure, this makes me go “hmm.”
2. ETFs in the Spotlight
In case you missed the announcement and description of this section, you can again.
It features some of the 10 broadly diversified domestic and sector ETFs from my HighVolume list as posted every Saturday. Furthermore, they are screened for the lowest MaxDD% number meaning they have been showing better resistance to temporary sell offs than all others over the past year.
The below table simply demonstrates the magnitude with which these ETFs are fluctuating above or below their respective individual trend lines (%+/-M/A). A break below, represented by a negative number, shows weakness, while a break above, represented by a positive percentage, shows strength.
For hundreds of ETF choices, be sure to reference Thursday’s StatSheet.
For this current domestic “Buy” cycle, here’s how some our candidates have fared:
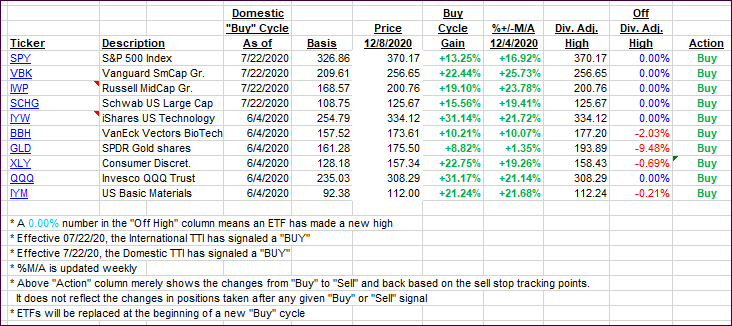
Click image to enlarge
Again, the %+/-M/A column above shows the position of the various ETFs in relation to their respective long-term trend lines, while the trailing sell stops are being tracked in the “Off High” column. The “Action” column will signal a “Sell” once the -8% point has been taken out in the “Off High” column. For more volatile sector ETFs, the trigger point is -10%.
3. Trend Tracking Indexes (TTIs)
Our TTIs were mixed with one gaining a tad and the other one fading.
This is how we closed 12/08/2020:
Domestic TTI: +22.36% above its M/A (prior close +22.02%)—Buy signal effective 07/22/2020
International TTI: +20.63% above its M/A (prior close +20.78%)—Buy signal effective 07/22/2020
Disclosure: I am obliged to inform you that I, as well as my advisory clients, own some of the ETFs listed in the above table. Furthermore, they do not represent a specific investment recommendation for you, they merely show which ETFs from the universe I track are falling within the specified guidelines.
Contact Ulli