
- Moving the markets
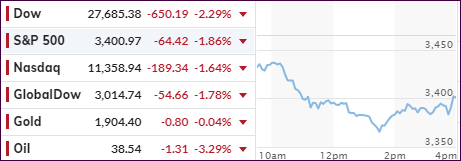
The futures markets already indicated equity weakness, which was confirmed after the opening bell rang. Stocks opened in the red and dove for most of the session until some buyers stepped in and reduced the early losses.
The storyline was the same as we heard last week, except traders have now come accept the fact that, despite hope to the opposite, “a final agreement on a new round of fiscal spending remains elusive, reflecting the lingering risks thwarting the economic recovery,” as MarketWatch described it.
Not helping the sour mood were news that new Covid-19 infections are rising in the U.S., while Europe saw Spain and Italy imposing tighter restrictions on activity, which in the case of Italy caused violent protests.
Anxiety also reigned supreme in anticipation of a huge earnings week ahead with more than 1/3 of the S&P 500 companies reporting, including the tech behemoths Facebook, Amazon, Apple, Microsoft, and Google.
ZH pointed out that reality is starting to dawn on a more than a few market participants that “Blue Wave odds are fading” amid the exposure of Biden’s corruption.
All the above combined for the major indexes to break crucial technical support levels, namely their respective 50-day M/As, as the VIX spiked to levels not seen since September.
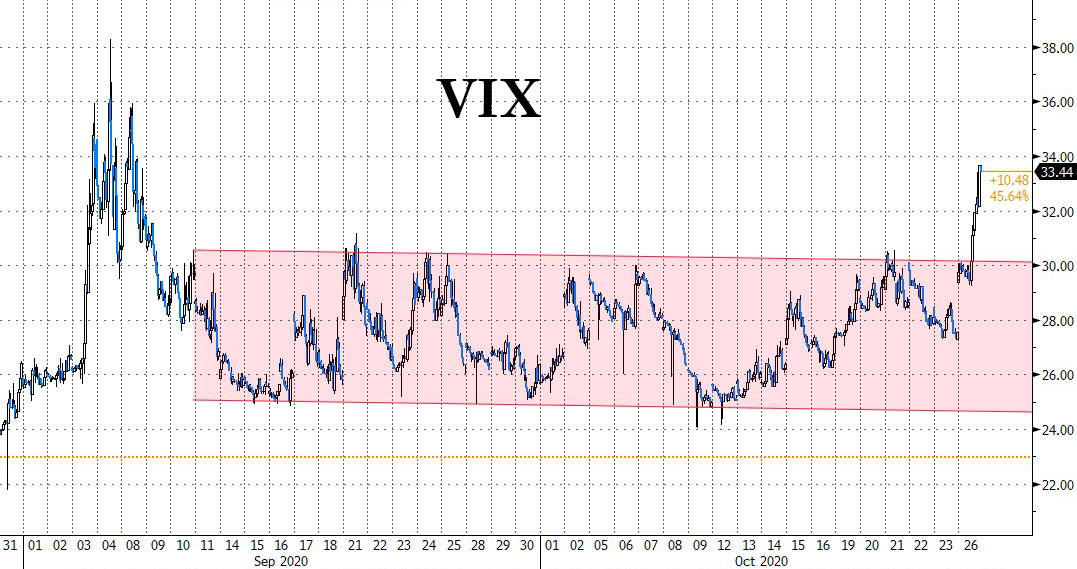
Despite the US dollar rallying, Gold held steady and closed at the unchanged line thereby justifying its value during times of turbulence.
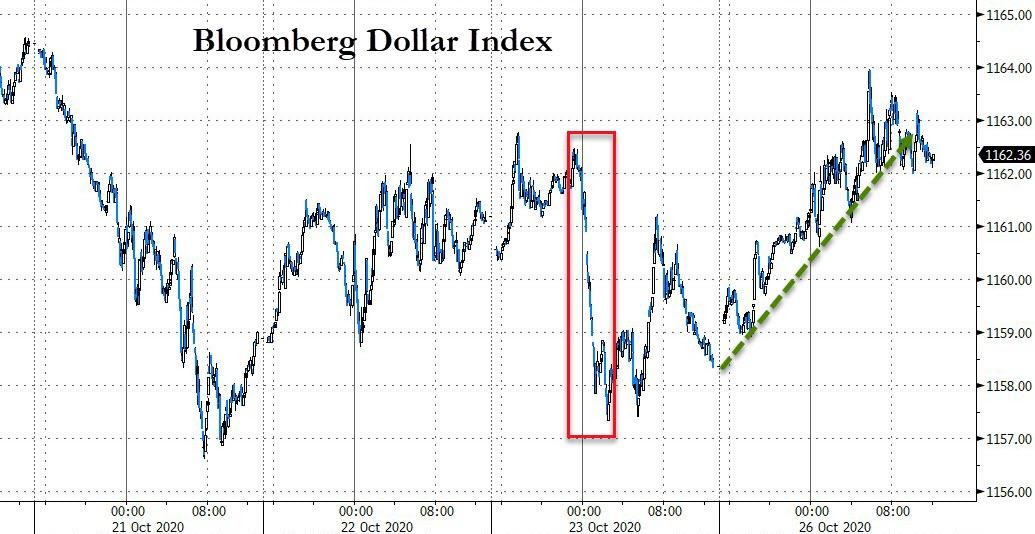
I posted over the past few weeks that uncertainty, and with-it volatility, would rise, which is why we took some profits back then and reduced our equity exposure. These are times where it pays to be cautions rather than stubborn and overly aggressive.
2. ETFs in the Spotlight
In case you missed the announcement and description of this section, you can read it here again.
It features some of the 10 broadly diversified domestic and sector ETFs from my HighVolume list as posted every Saturday. Furthermore, they are screened for the lowest MaxDD% number meaning they have been showing better resistance to temporary sell offs than all others over the past year.
The below table simply demonstrates the magnitude with which these ETFs are fluctuating above or below their respective individual trend lines (%+/-M/A). A break below, represented by a negative number, shows weakness, while a break above, represented by a positive percentage, shows strength.
For hundreds of ETF choices, be sure to reference Thursday’s StatSheet.
For this current domestic “Buy” cycle, here’s how some our candidates have fared:
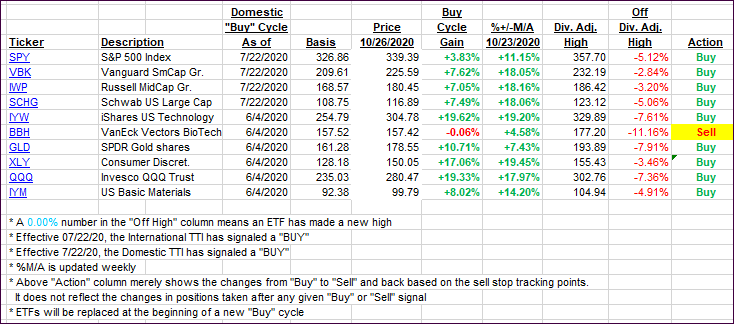
Click image to enlarge
Again, the %+/-M/A column above shows the position of the various ETFs in relation to their respective long-term trend lines, while the trailing sell stops are being tracked in the “Off High” column. The “Action” column will signal a “Sell” once the -8% point has been taken out in the “Off High” column. For more volatile sector ETFs, the trigger point is -10%.
3. Trend Tracking Indexes (TTIs)
Our TTIs dove with the markets but remain solidly on the bullish side of their respective trend lines.
This is how we closed 10/26/2020:
Domestic TTI: +9.02% above its M/A (prior close +11.62%)—Buy signal effective 07/22/2020
International TTI: +5.48% above its M/A (prior close +7.47%)—Buy signal effective 07/22/2020
Disclosure: I am obliged to inform you that I, as well as my advisory clients, own some of the ETFs listed in the above table. Furthermore, they do not represent a specific investment recommendation for you, they merely show which ETFs from the universe I track are falling within the specified guidelines.
Contact Ulli