- Moving the markets
A choppy but nevertheless positive follow through rally from yesterday’s rebound ran into a brick wall, reversed, and nosedived during the last hour of the session.
This would have not been a surprise had the usual suspects, like Covid-19 or the always headline-worthy tug-of-war stimulus battles been the cause, but today was different.
It was none other than President Trump, who prides himself as a contributor to the ever-bullish stock markets, who pulled the plug on the bulls by announcing that “stimulus talks are halted until after the election.”
Here’s what he tweeted:
Nancy Pelosi is asking for $2.4 Trillion Dollars to bailout poorly run, high crime, Democrat States, money that is in no way related to COVID-19.
We made a very generous offer of $1.6 Trillion Dollars and, as usual, she is not negotiating in good faith.
I am rejecting their request and looking to the future of our Country. I have instructed my representatives to stop negotiating until after the election when, immediately after I win, we will pass a major Stimulus Bill that focuses on hardworking Americans and Small Business.
I have asked Mitch McConnell not to delay, but to instead focus full time on approving my outstanding nominee to the United States Supreme Court, Amy Coney Barrett.
Our Economy is doing very well. The Stock Market is at record levels, JOBS and unemployment also coming back in record numbers. We are leading the World in Economic Recovery, and THE BEST IS YET TO COME!
To no surprise, the fallout in the markets was swift and immediate, as the chart above shows. Other than oil, the major indexes tumbled, as did gold, but the US dollar rallied along with bonds (lower yields).
There was no place to hide. FANG stocks got hammered, Growth, Value and Cyclicals all were smacked. It remains to be seen whether today’s drop was simply an outlier or a sign of things to come.
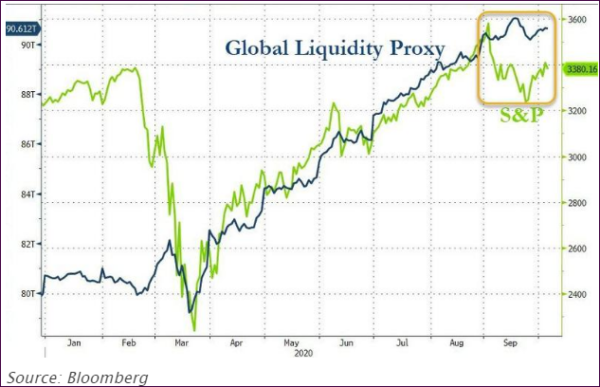
More interesting and somewhat concerting is the sudden divergence that appeared on this chart, which ZH pointed to:

Makes me wonder if this relationship has finally stopped working and liquidity’s role as the primary pump for the markets is ending.
2. ETFs in the Spotlight
In case you missed the announcement and description of this section, you can read it here again.
It features some of the 10 broadly diversified domestic and sector ETFs from my HighVolume list as posted every Saturday. Furthermore, they are screened for the lowest MaxDD% number meaning they have been showing better resistance to temporary sell offs than all others over the past year.
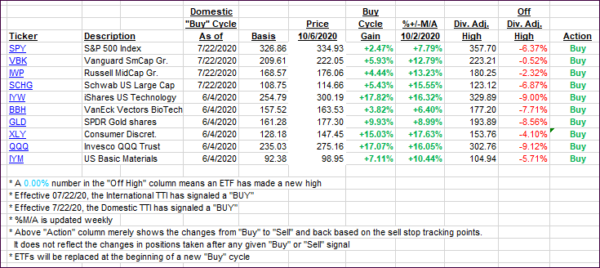
The below table simply demonstrates the magnitude with which these ETFs are fluctuating above or below their respective individual trend lines (%+/-M/A). A break below, represented by a negative number, shows weakness, while a break above, represented by a positive percentage, shows strength.
For hundreds of ETF choices, be sure to reference Thursday’s StatSheet.
For this current domestic “Buy” cycle, here’s how some our candidates have fared:

Click image to enlarge
Again, the %+/-M/A column above shows the position of the various ETFs in relation to their respective long-term trend lines, while the trailing sell stops are being tracked in the “Off High” column. The “Action” column will signal a “Sell” once the -8% point has been taken out in the “Off High” column. For more volatile sector ETFs, the trigger point is -10%.
3. Trend Tracking Indexes (TTIs)
Our TTIs reversed with the Domestic one taking more of a hit than its International cousin.
This is how we closed 10/06/2020:
Domestic TTI: +7.22% above its M/A (prior close +8.33%)—Buy signal effective 07/22/2020
International TTI: +4.41% above its M/A (prior close +4.61%)—Buy signal effective 07/22/2020
Disclosure: I am obliged to inform you that I, as well as my advisory clients, own some of the ETFs listed in the above table. Furthermore, they do not represent a specific investment recommendation for you, they merely show which ETFs from the universe I track are falling within the specified guidelines.
Contact Ulli