
- Moving the markets
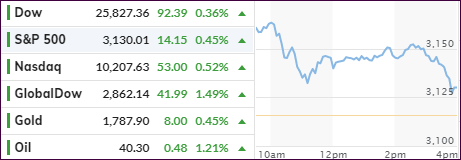
An early 400-point rally in the Dow bit the dust, as the major indexes faded towards the close but managed to end up in the green for the 4th session in a row.
Driving the initial gains were better than expected employment numbers of 4.8 million new jobs in June created vs. expectations for a 3.7 million rise, but this euphoric reaction may already be decelerating, as renewed surges of the coronavirus are causing shutdowns and subsequent layoffs.
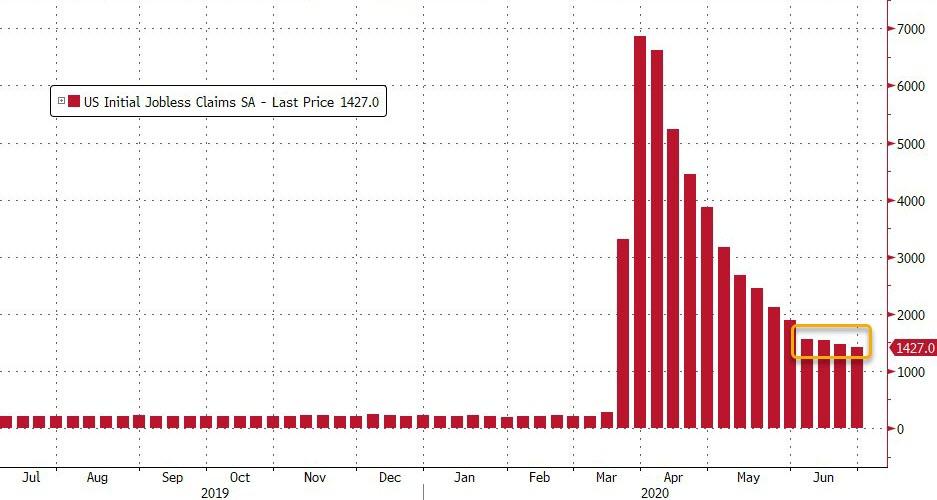
All of this exuberance could be offset by continued initial unemployment claims with the latest print showing 1.427 million new claims in the last week (above the 1.35 million expected). The chart shows that we saw some 6 million of new claims in June, which means, with only 4.8 million new jobs created, the employment numbers show no improvement at all.
But that does not matter, what matters is that the computer algos interpreted today’s numbers as a positive, and up we went.
Nothing seems real anymore, and as Global Macro Monitor reported, Larry Lindsey, the former director of the National Economic Council, came out this morning making a market call of 4,000 for the S&P 500 by the end of next year:
“…I just did some math on what is happening to the money supply…when you have a rapid expansion of the Fed’s balance sheet that the main effect is on asset prices….so I simply do the extrapolation…of what might be expected to happen in stock prices.” – Lawrence Lindsey
Ranted the Macro Monitor:
There you have it, folks, a forecast of the creation of more than $7 trillion of wealth over the next 18 months based, not on productivity gains, innovation, nor economic growth, but by keeping the digital printing press running.
Whether the wealth is real at the end of 2021 will depend on the purchasing power of the dollar, which we suspect will be lower than most currently expect.
At the end of this Holiday shortened week, the equities had their best week in 3 months, and that in the face of mounting Covid-19 comeback concerns, with many states continuing to reduce their business activity.
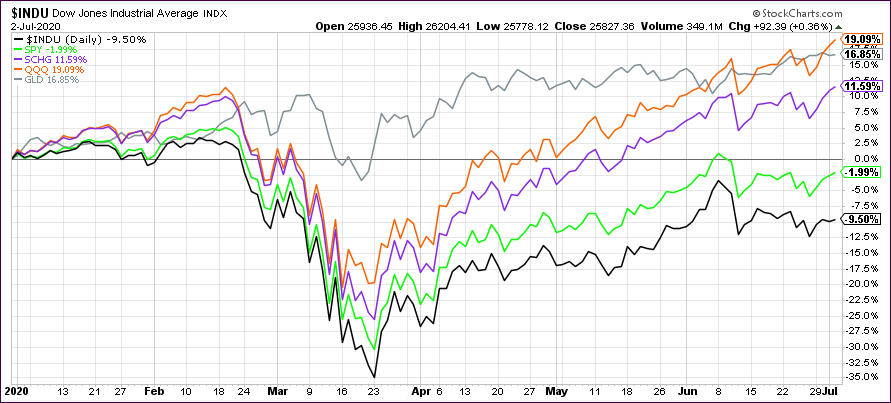
Despite all that, gold remains one of the best-performing asset classes YTD, but it looks like the Nasdaq just caught up today, while the Dow remains the laggard with -9.50%:
I will post the updated StatSheet this evening and the weekly Cutline report tomorrow.
Have a great 4th of July!
2. ETFs in the Spotlight
In case you missed the announcement and description of this section, you can read it here again.
It features some of the 10 broadly diversified domestic and sector ETFs from my HighVolume list as posted every Saturday. Furthermore, they are screened for the lowest MaxDD% number meaning they have been showing better resistance to temporary sell offs than all others over the past year.
The below table simply demonstrates the magnitude with which these ETFs are fluctuating above or below their respective individual trend lines (%+/-M/A). A break below, represented by a negative number, shows weakness, while a break above, represented by a positive percentage, shows strength.
For hundreds of ETF choices, be sure to reference Thursday’s StatSheet.
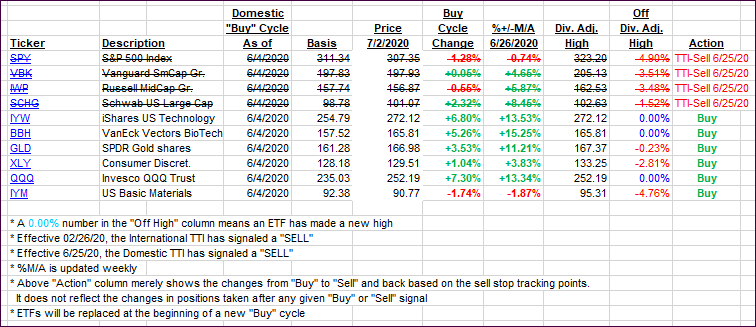
For this new domestic “Buy” cycle, which ended effective 6/25/2020, here’s how some our candidates have fared:
Click image to enlarge
Again, the %+/-M/A column above shows the position of the various ETFs in relation to their respective long-term trend lines, while the trailing sell stops are being tracked in the “Off High” column. The “Action” column will signal a “Sell” once the -8% point has been taken out in the “Off High” column. For more volatile sector ETFs, the trigger point is -10%.
3. Trend Tracking Indexes (TTIs)
Our TTIs improved with the markets maintain the bullish theme into the long weekend.
This is how we closed 07/02/2020:
Domestic TTI: -1.19% below its M/A (prior close -1.84%)—Sell signal effective 06/25/2020
International TTI: -2.24% below its M/A (prior close -3.50%)—Sell signal effective 02/26/2020
Disclosure: I am obliged to inform you that I, as well as my advisory clients, own some of the ETFs listed in the above table. Furthermore, they do not represent a specific investment recommendation for you, they merely show which ETFs from the universe I track are falling within the specified guidelines.
Contact Ulli