
- Moving the markets
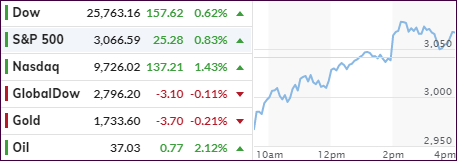
The markets took a dive this morning with the Dow skidding some 500 points, as fears about a resurgence of Covid-19 spooked traders around the world.
Analyst Graham Summers saw it this way:
Stocks have fallen hard over the weekend again. The media is pinning this drop on the potential for another COVID-19 pandemic, but the facts don’t support that theory.
My point with all of this is that today the market is literally a crap shoot. The easy money from the rally has been made, and the next trend is not clear yet. So now is NOT the time to be putting a load of capital to work.
Uncertainty in the markets needs to be eradicated with pointed action. That came in form of a 2nd press release by the Fed that it will now finally start buying corporate bonds, which was announced some three months ago but not yet executed.
However, since they were already buying between $1-2 trillion in corporate ETFs each weak, according to ZH, today’s confirmation provided enough ammo to propel the markets not only out of a deep hole but also to a solid green close.
The Fed made it clear that it is expanding the scope of its $750 billion emergency corporate loan facility to include individual corporate bonds, while at the same time reducing the restrictions for potential borrowers. Huh? In other words, even companies with inferior credit are encouraged to apply.
In the end, the markets were saved for another day with all eyes now being on Fed chair’s upcoming testimony about the state of the economy before Congress this week.
Our Domestic Trend Tracking Index (TTI) improved and is now in striking distance of breaking back above its trend line again (section 3), which means we are holding on to our current positions for the time being.
2. ETFs in the Spotlight
In case you missed the announcement and description of this section, you can read it here again.
It features some of the 10 broadly diversified domestic and sector ETFs from my HighVolume list as posted every Saturday. Furthermore, they are screened for the lowest MaxDD% number meaning they have been showing better resistance to temporary sell offs than all others over the past year.
The below table simply demonstrates the magnitude with which these ETFs are fluctuating above or below their respective individual trend lines (%+/-M/A). A break below, represented by a negative number, shows weakness, while a break above, represented by a positive percentage, shows strength.
For hundreds of ETF choices, be sure to reference Thursday’s StatSheet.
For this new domestic “Buy” cycle, which was effective 6/4/2020, here’s how some our candidates have fared:
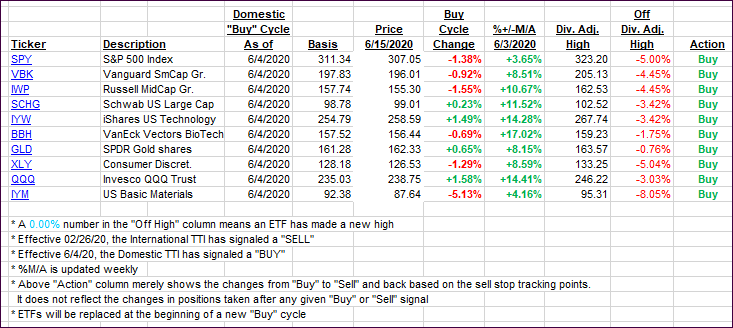
Click image to enlarge
Again, the %+/-M/A column above shows the position of the various ETFs in relation to their respective long-term trend lines, while the trailing sell stops are being tracked in the “Off High” column. The “Action” column will signal a “Sell” once the -8% point has been taken out in the “Off High” column. For more volatile sector ETFs, the trigger point is -10%.
3. Trend Tracking Indexes (TTIs)
Our Domestic TTI reversed and headed closer to breaking back above its long-term trend line and into bullish territory. While that is not a sure thing, we will hold on to our existing positions until a more substantial break to the downside confirms bearish tendencies.
This is how we closed 06/15/2020:
Domestic TTI: -0.96% below its M/A (prior close -2.04%)—Buy signal effective 06/04/2020
International TTI: -4.96% below its M/A (prior close -4.85%)—Sell signal effective 02/26/2020
Disclosure: I am obliged to inform you that I, as well as my advisory clients, own some of the ETFs listed in the above table. Furthermore, they do not represent a specific investment recommendation for you, they merely show which ETFs from the universe I track are falling within the specified guidelines.
Contact Ulli