
- Moving the markets
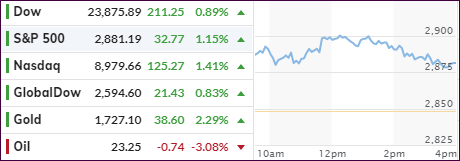
An early 400-point gain in the Dow got cut in half, but at least all three major indexes managed a green close.
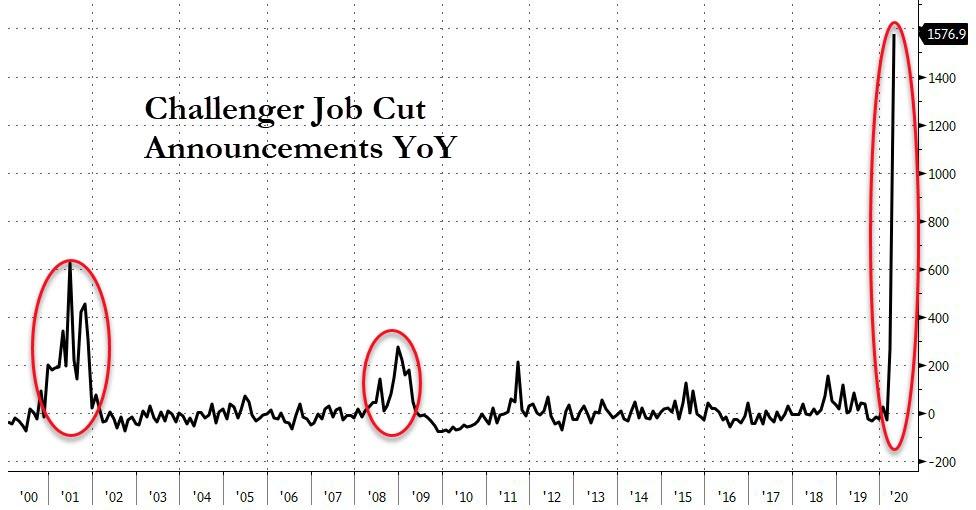
Jobless claims jumped by “only” 3.2 million in early May, which traders viewed as a slowing in job losses with some States now beginning to reopen their economies. The reality is that this still represents a 1576.9% surge in job cuts, according to Challenger, Gray and Christmas, with Bloomberg charting this fact here.
Leave it up to ZeroHedge to sum up the debacle of the last few months like this:
COVID-America: 73,400 Dead; 33 Million Jobless; Stocks Soaring
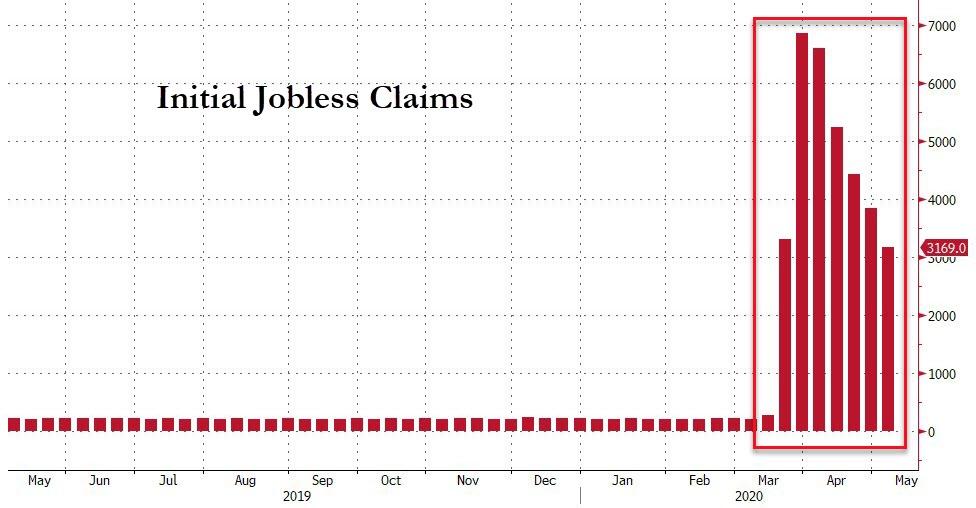
The initial jobless claims chart shows an improvement, which makes you wonder if that indeed warrants the current stock markets levels. After all, in the past 7 weeks, job losses now total 33.48 million, which is over 12 times the prior worst five-week period in the last 50-plus years.
For sure, without the Fed throwing trillions of dollars of liquidity at the markets, we would be nowhere near current valuations.
Current market reaction assumes that the reopening of the country happens swiftly, effectively and with everyone returning to their previous jobs. I disagree, and so does Michael Every of Rabo Bank:
“For all of us, as we re-open May will show us just how many firms are going to fail in this new post-lockdown normal. US ADP jobs printing at minus 20 million yesterday and media reports that temporary job furloughs are becoming permanent ones says we should expect a deluge to follow.”
Even Minneapolis Fed mouthpiece Neel Kashkari came out opining on tomorrow’s jobs report:
“It will likely understated the real unemployment picture, as it will only reflect people who are actively looking for work, a nearly impossible task in a time of nationwide lockdowns, and that the country should steel itself for a long, gradual recovery.”
“Friday jobs report that covers April will likely show an unemployment rate of 16% or 17%, but that the real number is around 23% or 24%, adding that “it’s devastating.”
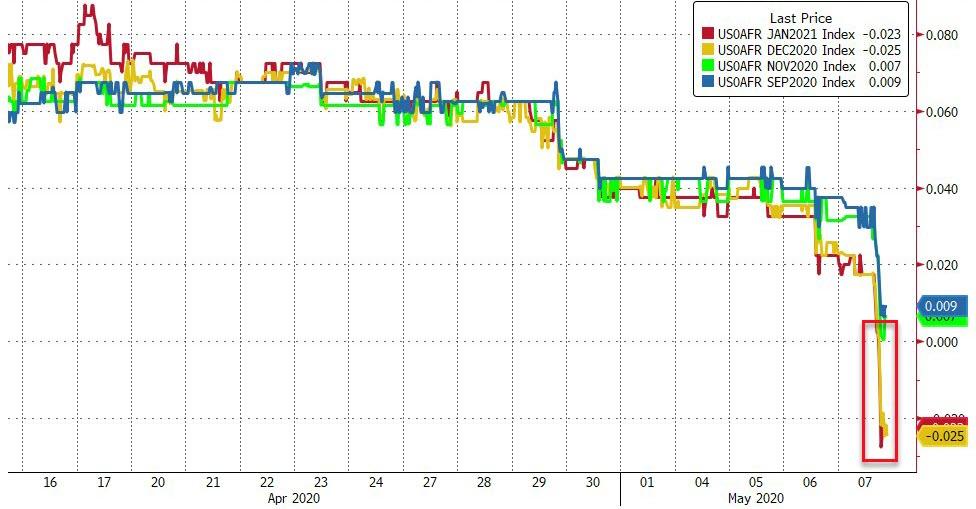
While these are only opinions, they are supported by the fact that some of the bond yields have hit record lows. We saw forecasts that negative rates are about to come true in a few months and are priced in for Q4 2020. The 2-year took out its previous record low today. All this was positive for gold, which rallied over 2%.
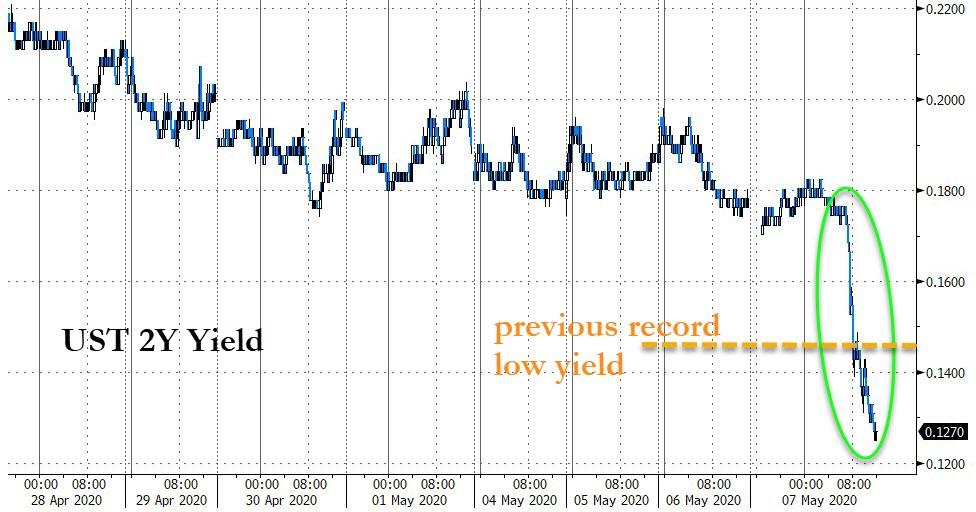
The decoupling from reality continues and, when looking at a global level, the picture looks just as bleak as domestically.
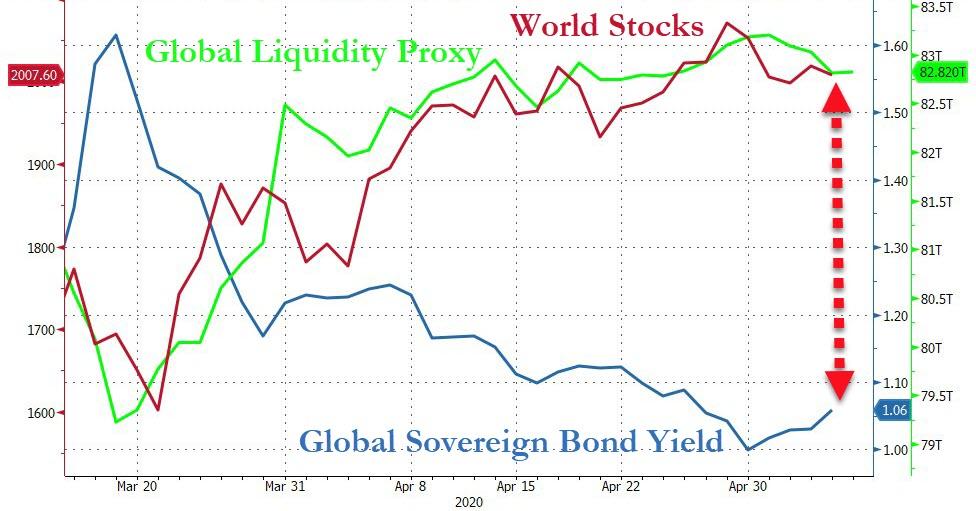
Right now, I am curious as to how much positive upward momentum the computer algos can squeeze out of tomorrow’s jobs report.
2. ETFs in the Spotlight
In case you missed the announcement and description of this section, you can read it here again.
It features some of the 10 broadly diversified domestic and sector ETFs from my HighVolume list as posted every Saturday. Furthermore, they are screened for the lowest MaxDD% number meaning they have been showing better resistance to temporary sell offs than all others over the past year.
The below table simply demonstrates the magnitude with which these ETFs are fluctuating above or below their respective individual trend lines (%+/-M/A). A break below, represented by a negative number, shows weakness, while a break above, represented by a positive percentage, shows strength.
For hundreds of ETF choices, be sure to reference Thursday’s StatSheet.
For this past domestic “Buy” cycle, which ended on 2/27/2020, here’s how some our candidates have fared:
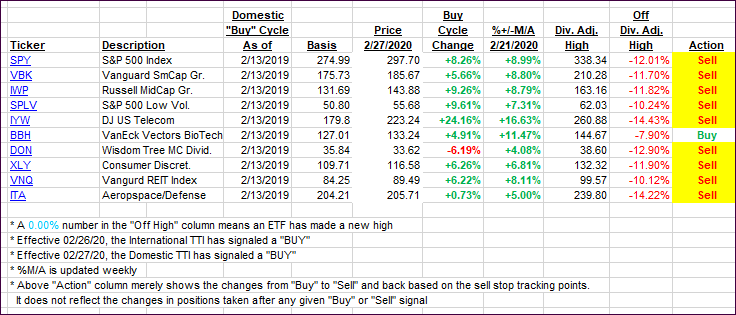
Click image to enlarge
Again, the %+/-M/A column above shows the position of the various ETFs in relation to their respective long-term trend lines, while the trailing sell stops are being tracked in the “Off High” column. The “Action” column will signal a “Sell” once the -8% point has been taken out in the “Off High” column. For more volatile sector ETFs, the trigger point is -10%.
3. Trend Tracking Indexes (TTIs)
Our TTIs improved with the markets hanging on to a green close.
This is how we closed 05/07/2020:
Domestic TTI: -10.90% below its M/A (prior close -12.47%)—Sell signal effective 02/27/2020
International TTI: -12.96% below its M/A (prior close -13.73%)—Sell signal effective 02/26/2020
Disclosure: I am obliged to inform you that I, as well as my advisory clients, own some of the ETFs listed in the above table. Furthermore, they do not represent a specific investment recommendation for you, they merely show which ETFs from the universe I track are falling within the specified guidelines.
Contact Ulli