
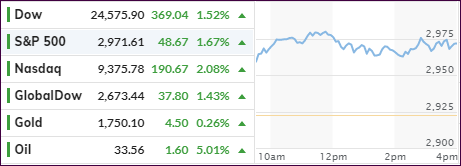
[Chart courtesy of MarketWatch.com]
- Moving the markets
Today, upbeat quarterly earnings results from Target and Lowe’s set a positive tone and sent the major indexes to 10-week highs. However, as soon as news of a bill to delist Chinese companies from the US exchanges cleared the senate, equities came off their best levels of the day.
The focus remained predominantly on the positives of the reopening plans, which vary widely from state to state, but many are trying to lift restrictions prior to the upcoming long Memorial Day weekend.
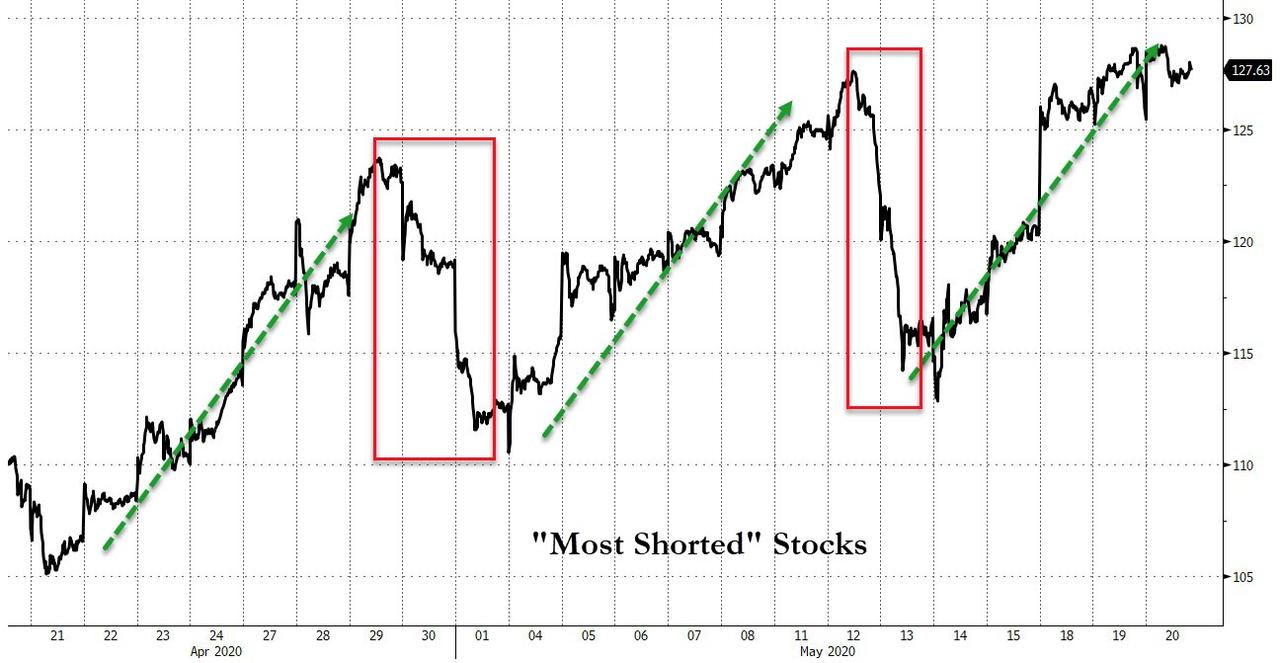
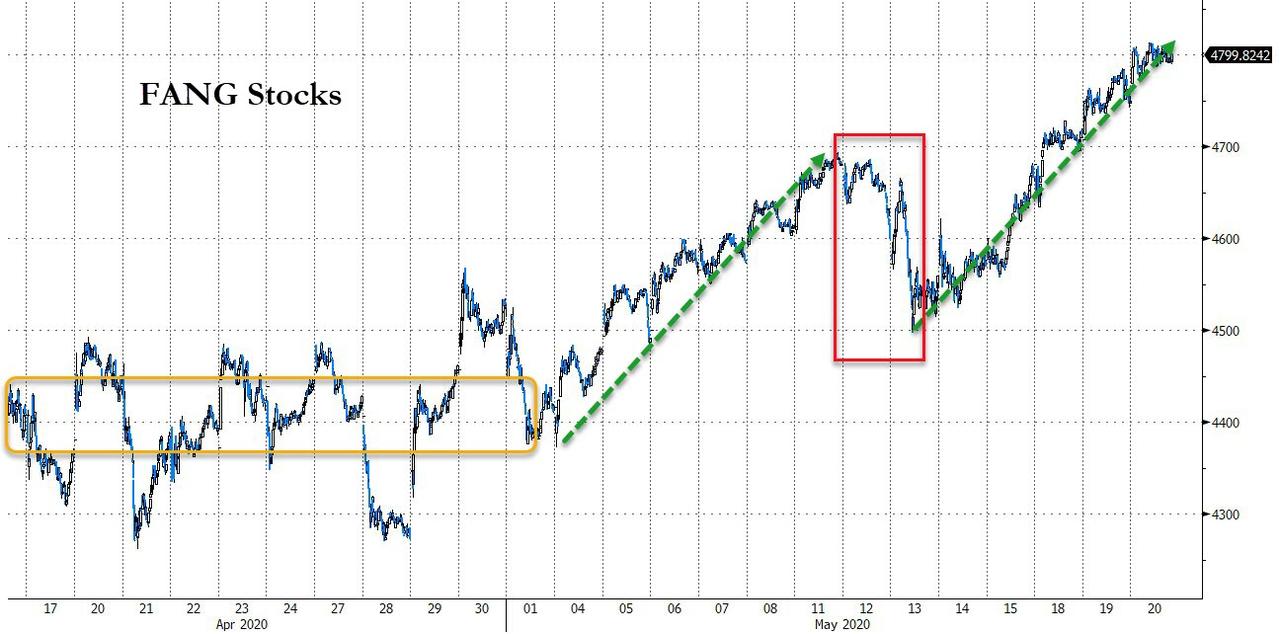
Throwing a big assist, as we’ve seen often in the recent past, was another giant short-squeeze right after the opening bell, as Bloomberg shows in this chart. This has been the go-to trade ever since the March lows, and it has been executed perfectly. Also doing some of the heavy lifting were the FANG stocks, which rallied to new highs—again.
The positions of our Trend Tracking Indexes (TTIs) continues to improve, but it will take more of a bullish effort to pull the trigger for a new “Buy” signal. Right now, the S&P 500 (SPY) needs to gain over 2% from current levels, just to get to the point of where our February 27, 2020 “Sell” signal kicked in.
In the meantime, some of our sector ETFs, which run on their own cycles, are showing promising possibilities, and I intend to start nibbling carefully.
2. ETFs in the Spotlight
In case you missed the announcement and description of this section, you can read it here again.
It features some of the 10 broadly diversified domestic and sector ETFs from my HighVolume list as posted every Saturday. Furthermore, they are screened for the lowest MaxDD% number meaning they have been showing better resistance to temporary sell offs than all others over the past year.
The below table simply demonstrates the magnitude with which these ETFs are fluctuating above or below their respective individual trend lines (%+/-M/A). A break below, represented by a negative number, shows weakness, while a break above, represented by a positive percentage, shows strength.
For hundreds of ETF choices, be sure to reference Thursday’s StatSheet.
For this past domestic “Buy” cycle, which ended on 2/27/2020, here’s how some our candidates have fared:
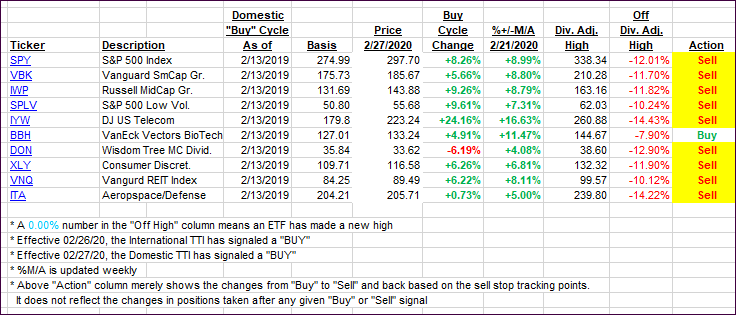
Click image to enlarge
Again, the %+/-M/A column above shows the position of the various ETFs in relation to their respective long-term trend lines, while the trailing sell stops are being tracked in the “Off High” column. The “Action” column will signal a “Sell” once the -8% point has been taken out in the “Off High” column. For more volatile sector ETFs, the trigger point is -10%.
3. Trend Tracking Indexes (TTIs)
Our TTIs improved but still have a way to go before a new Domestic Buy cycle is generated. However, some of our sector funds are offering some possibilities I may take advantage of.
This is how we closed 05/20/2020:
Domestic TTI: -7.44% below its M/A (prior close -9.10%)—Sell signal effective 02/27/2020
International TTI: -9.78% below its M/A (prior close -11.09%)—Sell signal effective 02/26/2020
Disclosure: I am obliged to inform you that I, as well as my advisory clients, own some of the ETFs listed in the above table. Furthermore, they do not represent a specific investment recommendation for you, they merely show which ETFs from the universe I track are falling within the specified guidelines.
Contact Ulli