
- Moving the markets
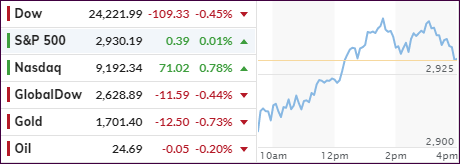
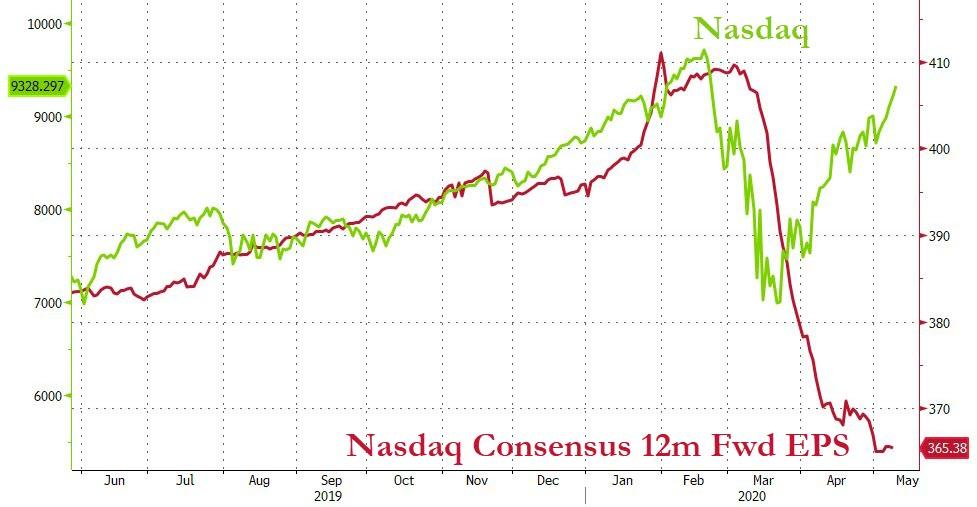
An early drop was followed by a mid-day pop, then momentum faded, and the Dow dove back into the red. The S&P 500 ended just about unchanged, but the Nasdaq ruled and closed in the green despite a total collapse in earnings.
It appears that early optimism about the step-by-step re-opening of the country was met by skepticism in that more hurdles than expected remain, while a V-shape type of recovery at this point remains a pipe dream.
As Bloomberg notes:
“With a majority of companies having now reported earnings in Europe and the U.S., the figures have been poorer than expected; and the second quarter will likely be even worse, given the lockdowns, and a recovery in the rest of the year isn’t obvious.”
Author Bruce Wilds added these succinct comments:
“It has become difficult to comprehend the size of the failure the political-financial complex has designed. This is partly because stocks have continued to soar with every announcement of rising unemployment and even as businesses continue to fail or file for bankruptcy. Bad news is not good news. The sick idea that poor spending habits are the answer to achieving a faster-growing economy is absurd and twisted. This is not new; politicians seem unable to grasp the fact economic growth does not necessarily bring about economic strength or long-term prosperity.“
With Saxo Bank summing it up like this:
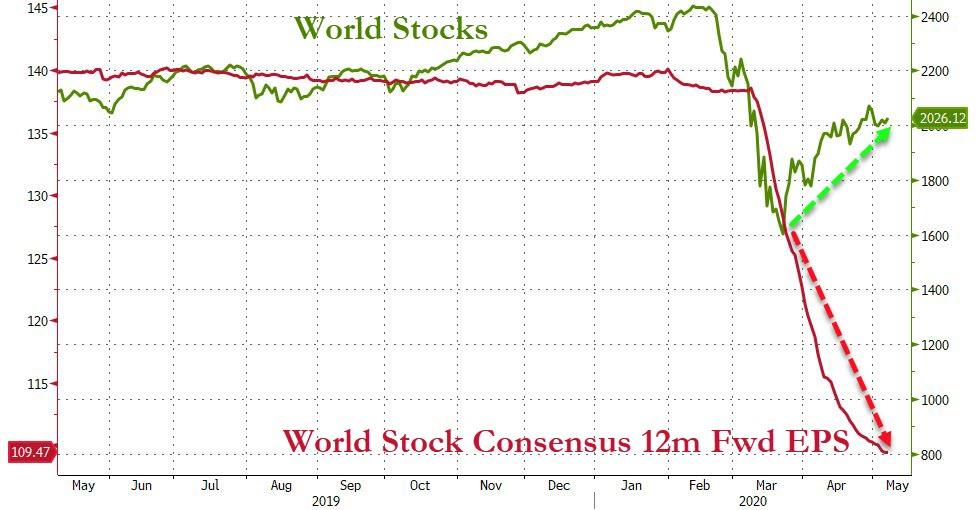
“Investors continue to buy the reopening story, with markets remaining completely detached from fundamentals and the real economy.“
In other words, it’s no longer a secret that markets are out of sync with economic realty. However, should this relentless push higher continue, it’s certain that our Trend Tracking Indexes TTIs) will trigger a new “Buy” signal, which we will then use as a new entry point.
Right now, we are still watching the developments from the sidelines.
2. ETFs in the Spotlight
In case you missed the announcement and description of this section, you can read it here again.
It features some of the 10 broadly diversified domestic and sector ETFs from my HighVolume list as posted every Saturday. Furthermore, they are screened for the lowest MaxDD% number meaning they have been showing better resistance to temporary sell offs than all others over the past year.
The below table simply demonstrates the magnitude with which these ETFs are fluctuating above or below their respective individual trend lines (%+/-M/A). A break below, represented by a negative number, shows weakness, while a break above, represented by a positive percentage, shows strength.
For hundreds of ETF choices, be sure to reference Thursday’s StatSheet.
For this past domestic “Buy” cycle, which ended on 2/27/2020, here’s how some our candidates have fared:
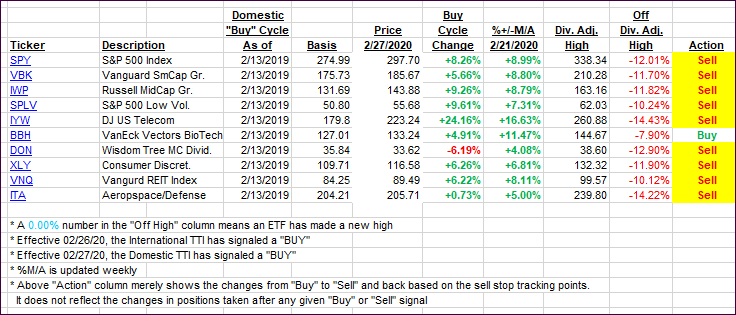
Click image to enlarge
Again, the %+/-M/A column above shows the position of the various ETFs in relation to their respective long-term trend lines, while the trailing sell stops are being tracked in the “Off High” column. The “Action” column will signal a “Sell” once the -8% point has been taken out in the “Off High” column. For more volatile sector ETFs, the trigger point is -10%.
3. Trend Tracking Indexes (TTIs)
Our TTIs dropped with the Domestic one showing more weakness.
This is how we closed 05/11/2020:
Domestic TTI: -9.37% below its M/A (prior close -8.28%)—Sell signal effective 02/27/2020
International TTI: -11.57% below its M/A (prior close -11.28%)—Sell signal effective 02/26/2020
Disclosure: I am obliged to inform you that I, as well as my advisory clients, own some of the ETFs listed in the above table. Furthermore, they do not represent a specific investment recommendation for you, they merely show which ETFs from the universe I track are falling within the specified guidelines.
Contact Ulli