
- Moving the markets
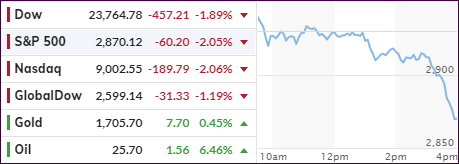
An early rally ran into trouble, reversed, accelerated, and got slammed down with the Dow dropping some 450 points, or -1.9%, with the other two major indexes scoring slightly worse.
The initial bounce was a result of positive interpretations of the partial reopening of the economy, despite many facts pointing to a disappointing return to business with many malls reporting hardly any customers.
To me, this means that the reckless consumerism of the past may have hit a brick wall. Nowadays, with record high unemployment, most people have more serious concerns than spending money they don’t have for things they don’t need. Should this attitude prevail, however, it will have serious ramifications, when you consider that about 70% of U.S. GDP comes from consumer spending.
Noted Global Macro Monitor:
“There will likely be an initial burst of economic activity due to a huge pent-up demand as America opens for business, but the long-term reality will be determined by how much damage and hysteresis the lock-down has inflicted.”
Hysteresis in the field of economics refers to an event in the economy that persists into the future, even after the factors that led to that event have been removed.
– Investopedia
In terms of economic data, we learned that the Core CPI crashed the most on record, as ZH reported, but food costs soared while energy and apparel collapsed.
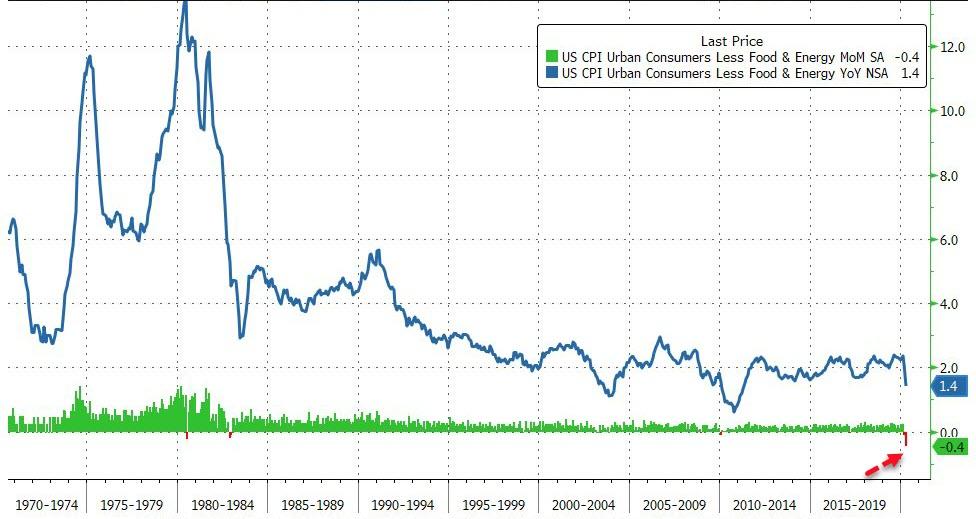
Helping the markets accelerate to the downside was a report that GOP senators have introduced a bill sanctioning China. The reaction was swift with Treasury yields extending their decline and stocks getting hammered.
Technically speaking, the S&P 500 has now bounced off its overhead ceiling in the 2,920 area (yellow arrow) several times:
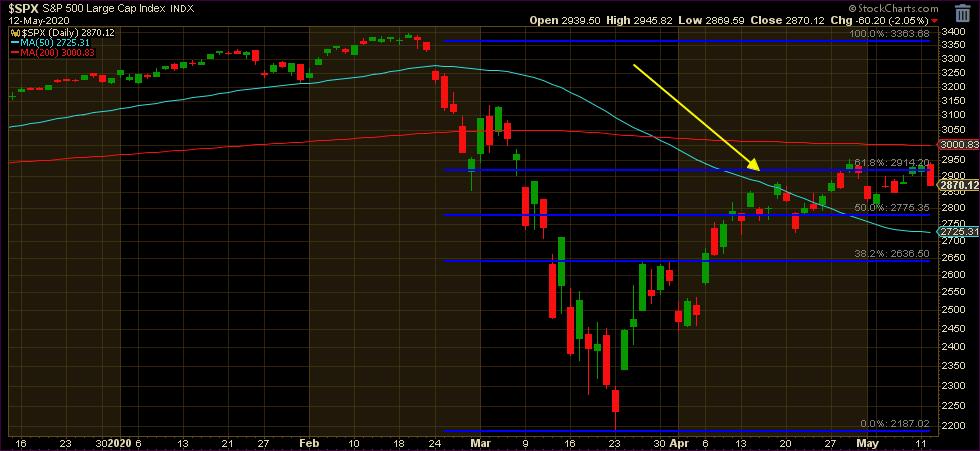
Should this level be solidly breached to the upside, we may be on our way to receiving a new domestic “Buy” signal, while the markets in general subsequently could be aiming to take out their previous all-time highs.
Like it or not, this would not be a function of a great economy, quite the opposite, it would be the result of reckless money printing, and the Fed buying up assets to support the bullish theme.
2. ETFs in the Spotlight
In case you missed the announcement and description of this section, you can read it here again.
It features some of the 10 broadly diversified domestic and sector ETFs from my HighVolume list as posted every Saturday. Furthermore, they are screened for the lowest MaxDD% number meaning they have been showing better resistance to temporary sell offs than all others over the past year.
The below table simply demonstrates the magnitude with which these ETFs are fluctuating above or below their respective individual trend lines (%+/-M/A). A break below, represented by a negative number, shows weakness, while a break above, represented by a positive percentage, shows strength.
For hundreds of ETF choices, be sure to reference Thursday’s StatSheet.
For this past domestic “Buy” cycle, which ended on 2/27/2020, here’s how some our candidates have fared:
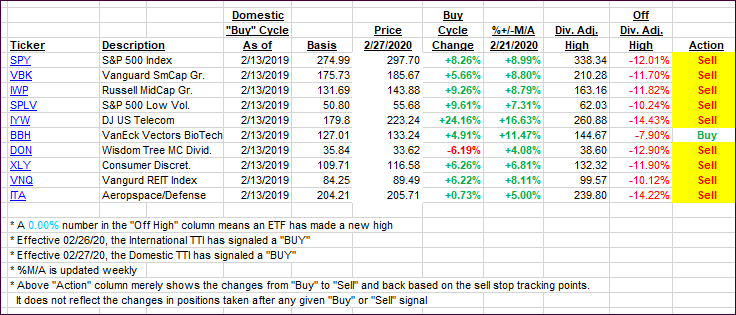
Click image to enlarge
Again, the %+/-M/A column above shows the position of the various ETFs in relation to their respective long-term trend lines, while the trailing sell stops are being tracked in the “Off High” column. The “Action” column will signal a “Sell” once the -8% point has been taken out in the “Off High” column. For more volatile sector ETFs, the trigger point is -10%.
3. Trend Tracking Indexes (TTIs)
Our TTIs headed south, as the major indexes got spanked late in the session.
This is how we closed 05/12/2020:
Domestic TTI: -11.74% below its M/A (prior close -9.37%)—Sell signal effective 02/27/2020
International TTI: -12.57% below its M/A (prior close -11.57%)—Sell signal effective 02/26/2020
Disclosure: I am obliged to inform you that I, as well as my advisory clients, own some of the ETFs listed in the above table. Furthermore, they do not represent a specific investment recommendation for you, they merely show which ETFs from the universe I track are falling within the specified guidelines.
Contact Ulli