
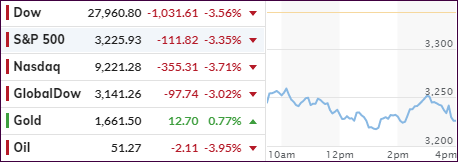
[Chart courtesy of MarketWatch.com]
- Moving the markets
World markets joined in unison by selling off with weekend news about the coronavirus continuing worries that global economies will not escape unscathed and take a hit of unknown proportions.
Sure, news media and markets tend to overreact, but the negative virus effects can’t be denied, as the struggle with containment policies and massive unknowns seem to get worse.
It’s no surprise that markets are feeling nervous this morning, given the known facts, which analyst Bill Blain summarized as follows:
The economic damage in terms of cancelled tourist trips to Asia and vice-versa, empty container ships, global supply chain breakdown shuttering factories across the globe, commodities tumbling, raising fears of mass defaults as just-in-time manufacturers fail to make interest payments is clear.
He went on to elaborate:
This crisis comes at the top of massive bubbles in stocks and bonds, fueled by 10-years of accommodative monetary experimentation – just at a time when the global monetary authorities are increasingly understanding the urgent need undo the unintended negative consequences, end QE, to normalize interest rates and take the pressure out of asset bubbles.
Forget about normalizing interest rates, it will be the opposite with bond yields crashing this morning, as the 10-year dropped some 10 basis points to below 1.40%. Considering the above, I believe the Central Banks will go all out and provide further “accommodative” policy support meaning yields will be heading towards the zero bound, as is the case in many developed countries.
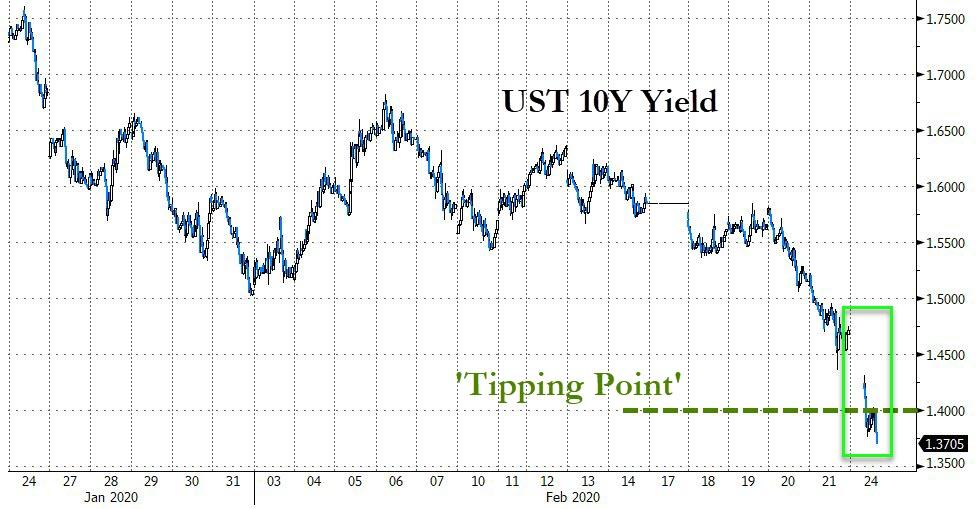
As ZH points out in the above chart, a break below this “tipping point,” increases the probability to more than 50% of the Fed cutting back rates to 0%.
Along those lines, we may very well witness a well-known mantra come into play, set in motion by former ECB president Draghi, for the Fed to do “whatever it takes” to avoid an economic breakdown.
In the end, for us trend trackers, the only things that matter are: Is the major trend is still intact and/or have any sell stops been triggered?
For right now, the answer to both is no (see section 3 below), so we will continue to hold until either one of these two conditions come into play.
Despite today’s snapping of complacency, it’s also noteworthy that the S&P 500 closed today at the same price it had when the month of February started and remains within 5% of its all-time highs.
2. ETFs in the Spotlight
In case you missed the announcement and description of this section, you can again.
It features 10 broadly diversified and sector ETFs from my HighVolume list as posted every Saturday. Furthermore, they are screened for the lowest MaxDD% number meaning they
have been showing better resistance to temporary sell offs than all others over the past year.
The below table simply demonstrates the magnitude with which some of the ETFs are fluctuating regarding their positions above or below their respective individual trend lines (%+/-M/A). A break below, represented by a negative number, shows weakness, while a break above, represented by a positive percentage, shows strength.
For hundreds of ETF choices, be sure to reference Thursday’s StatSheet.
For this current domestic “Buy” cycle, here’s how some our candidates have fared:
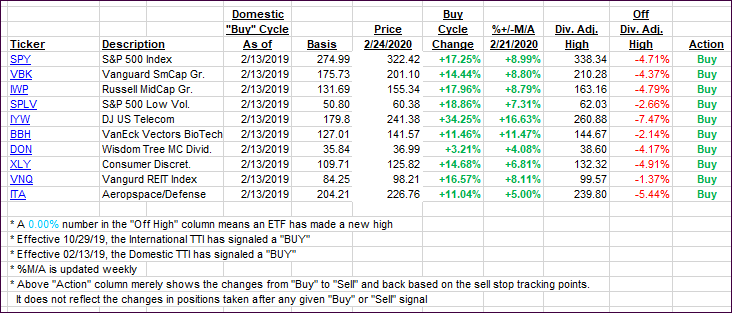
Click image to enlarge
Again, the %+/-M/A column above shows the position of the various ETFs in relation to their respective long-term trend lines, while the trailing sell stops are being tracked in the “Off High” column. The “Action” column will signal a “Sell” once the -8% point has been taken out in the “Off High” column. For more volatile sector ETFs, the trigger point is -10%.
3. Trend Tracking Indexes (TTIs)
Our Trend Tracking Indexes (TTIs) stumbled as the worsening coronavirus outlook favored the bears.
Here’s how we closed 02/24/2020:
Domestic TTI: +3.83% above its M/A (prior close +7.08%)—Buy signal effective 02/13/2019
International TTI: +1.17% above its M/A (prior close +4.33%)—Buy signal effective 10/29/2019
Disclosure: I am obliged to inform you that I, as well as my advisory clients, own some of the ETFs listed in the above table. Furthermore, they do not represent a specific investment recommendation for you, they merely show which ETFs from the universe I track are falling within the specified guidelines.
Contact Ulli