
[Chart courtesy of MarketWatch.com]
- Moving the markets
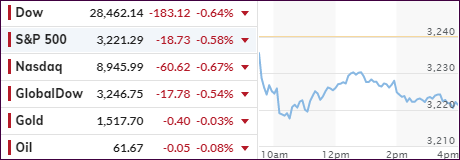
For the first time in some 4 weeks, equity markets took a dive right at the opening and, despite a valiant attempt to rebound back to the various unchanged lines, they stalled and slid into the close.
However, given the relentless move higher over the recent past, today’s pullback is hardly worth mentioning, as the S&P 500 surrendered only -0.58% thereby ‘beating’ the Dow and Nasdaq.
There was no catalyst for this pullback other than traders’ view that the recent sprint into record territory was overdone, and a break was in order. Even news on the easing of the trade tensions with China had no effect, as the bears finally had a reason to cheer.
Of course, trading volumes were thin, which could have been a contributor to today’s losses. The markets will be closed on New Year’s Day, not just here in the U.S. but in most parts around the world.
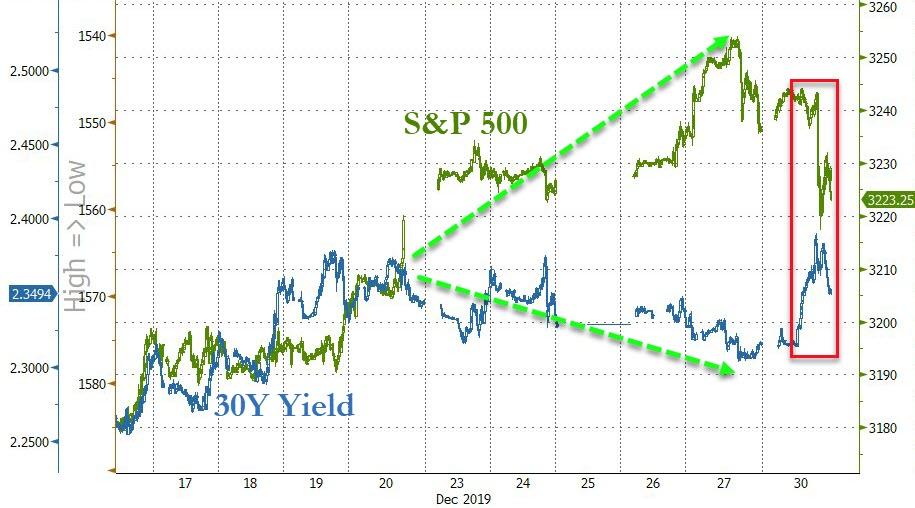
As ZH pointed out, the long-awaited recoupling between stocks (down) and bond yields (up) finally occurred today, after the decoupling on 12/20/19. However, we need to see more time pass to properly evaluate if this is the beginning of a new directional movement for these two asset classes, or if today was just an interruption of the prevailing trend.
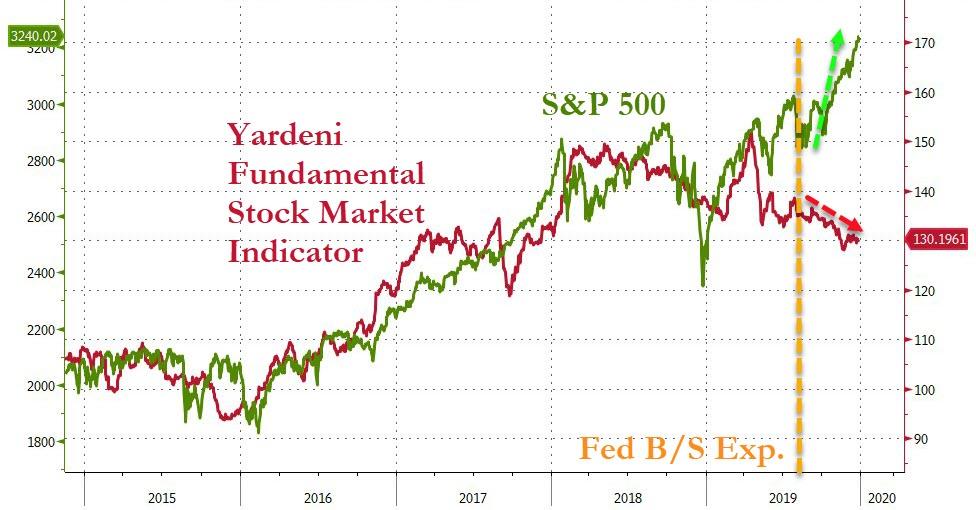
Looking at Ed Yardeni’s Fundamental Stock Market Indicator, we see that it currently signals that the S&P 500 is overvalued by about 20%. Only time will tell, if this index has forecasting value.
2. ETFs in the Spotlight
In case you missed the announcement and description of this section, you can read it here again.
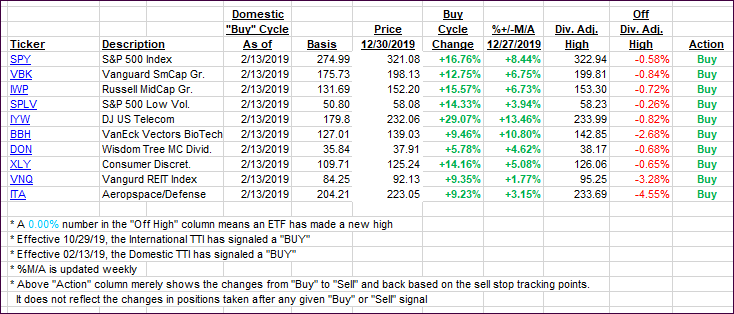
It features 10 broadly diversified and sector ETFs from my HighVolume list as posted every Saturday. Furthermore, they are screened for the lowest MaxDD% number meaning they have been showing better resistance to temporary sell offs than all others over the past year.
The below table simply demonstrates the magnitude with which some of the ETFs are fluctuating regarding their positions above or below their respective individual trend lines (%+/-M/A). A break below, represented by a negative number, shows weakness, while a break above, represented by a positive percentage, shows strength.
For hundreds of ETF choices, be sure to reference Thursday’s StatSheet.
For this current domestic “Buy” cycle, here’s how some our candidates have fared:
Click image to enlarge
Again, the %+/-M/A column above shows the position of the various ETFs in relation to their respective long-term trend lines, while the trailing sell stops are being tracked in the “Off High” column. The “Action” column will signal a “Sell” once the -8% point has been taken out in the “Off High” column. For more volatile sector ETFs, the trigger point is -10%.
3. Trend Tracking Indexes (TTIs)
Our Trend Tracking Indexes (TTIs) pulled back, as the major indexes closed in the red.
Here’s how we closed 12/30/2019:
Domestic TTI: +7.31% above its M/A (prior close +7.68%)—Buy signal effective 02/13/2019
International TTI: +6.02% above its M/A (prior close +6.62%)—Buy signal effective 10/29/2019
Disclosure: I am obliged to inform you that I, as well as my advisory clients, own some of the ETFs listed in the above table. Furthermore, they do not represent a specific investment recommendation for you, they merely show which ETFs from the universe I track are falling within the specified guidelines.
Contact Ulli