
- Moving the markets
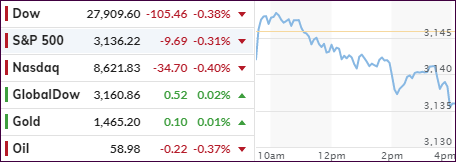
Despite several attempts, the bulls were not able to sustain Friday’s upward momentum, and the major indexes pulled back to close moderately in the red, but the dive into the close could be cause for concern.
Trade negotiations were in focus again ahead of the looming deadline on US-China tariffs, along with a variety of updates from global central banks.
First, the Fed is set to do its 2-day meeting starting Tuesday, while the ECB, under the new leadership of Christine Lagarde, is scheduled to hold its convention on Thursday.
Of course, traders are cautious never being 100% certain as to the outlook for interest rates and what some commentary on the state of the global economy might contain. That uncertainty will continue into the weekend when on December 15, Trump will decide whether to implement $156 billion in Chinese tariffs or grant an extension.
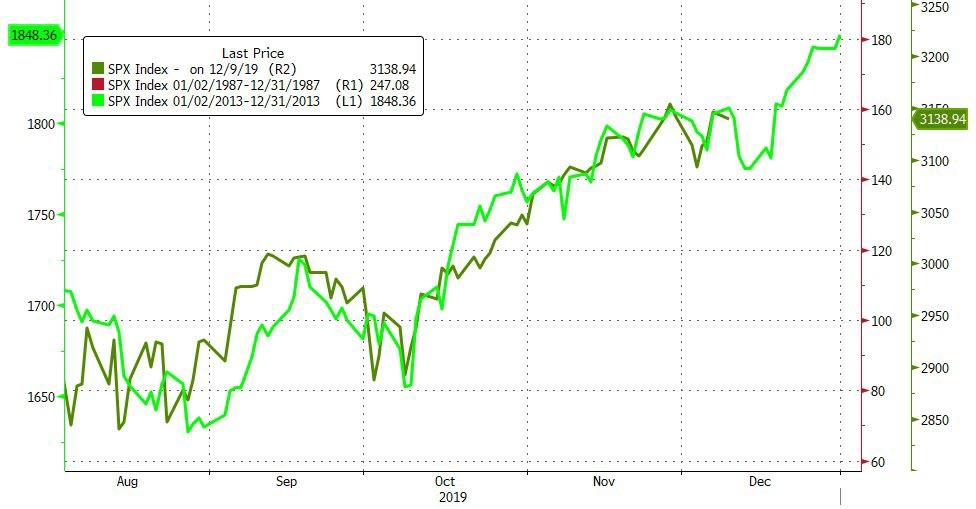
For now, according to Bloomberg, the S&P 500 in 1919 is tracking its performance from the year 2013 with amazing accuracy, as this chart shows. We’ll find out soon if that performance will deviate in the last few weeks of 2019, or not.
2. ETFs in the Spotlight
In case you missed the announcement and description of this section, you can read it here again.
It features 10 broadly diversified and sector ETFs from my HighVolume list as posted every Saturday. Furthermore, they are screened for the lowest MaxDD% number meaning they have been showing better resistance to temporary sell offs than all others over the past year.
The below table simply demonstrates the magnitude with which some of the ETFs are fluctuating regarding their positions above or below their respective individual trend lines (%+/-M/A). A break below, represented by a negative number, shows weakness, while a break above, represented by a positive percentage, shows strength.
For hundreds of ETF choices, be sure to reference Thursday’s StatSheet.
For this current domestic “Buy” cycle, here’s how some our candidates have fared:
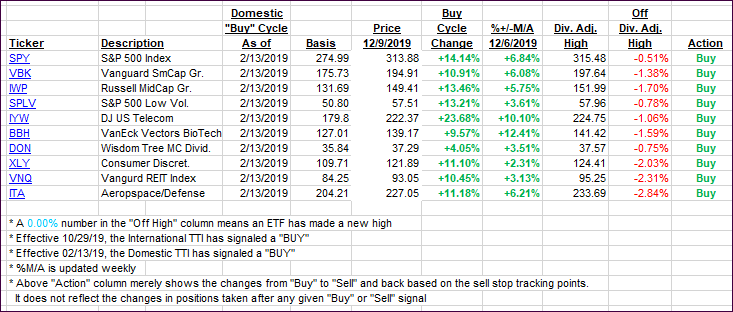
Click image to enlarge
Again, the %+/-M/A column above shows the position of the various ETFs in relation to their respective long-term trend lines, while the trailing sell stops are being tracked in the “Off High” column. The “Action” column will signal a “Sell” once the -8% point has been taken out in the “Off High” column. For more volatile sector ETFs, the trigger point is -10%.
3. Trend Tracking Indexes (TTIs)
Our Trend Tracking Indexes (TTIs) slipped as markets took a breather from the torrent pace set last Friday.
Here’s how we closed 12/9/2019:
Domestic TTI: +5.67% above its M/A (prior close +6.00%)—Buy signal effective 02/13/2019
International TTI: +3.83% above its M/A (prior close +3.88%)—Buy signal effective 10/29/2019
Disclosure: I am obliged to inform you that I, as well as my advisory clients, own some of the ETFs listed in the above table. Furthermore, they do not represent a specific investment recommendation for you, they merely show which ETFs from the universe I track are falling within the specified guidelines.
Contact Ulli