- Moving the markets
Yesterday’s attempt by Trump to put some lipstick on the trade pig, via a possible delay of certain tariffs, now seems to have had only a one-day effect with global realities taking front and center.
Newly released data shows a worrisome development regarding economic growth with China and Europe’s economic powerhouse Germany both presenting weak data. Chinese production slowed to 4.8% YoY, its lowest level since 2002, while retails sales came in way below consensus. But at least they’re showing positive numbers.
That can’t be said for Germany, which showed its GDP contracting -0.1% in the second quarter, the first time since the 3rd quarter of 2018. Much is contributed to the impending Brexit later this year.
But the nail in the market’s coffin, at least for today, was the bond market where the 2/10 yield inverted for the first time in 12 years. What that simply means is that, if you invest in a 2-year bond, you will get a higher rate of return than for a 10-year bond. Insane! The 30-year bond plunged to a record low yield as well.
This type of inversion (2/10) has always signaled an upcoming recession, which is why we saw this violent market move today. The damage was widely spread, but the low volatility SPLV softened the blow somewhat (-1.98%) vs. the S&P 500’s -2.93%.
Our Trend Tracking Indexes (TTIs) came under fire as well (see section 3), and the Domestic one has reached a point that is within a hair of generating a ‘Sell’ signal. If this should materialize, we could see more downside damage with the potential of re-visiting the December lows now appearing to be a real possibility.
Of course, these days some more bad news could be interpreted as good news by the speed-reading computer algos, and we could be going back the other way.
2. ETFs in the Spotlight
In case you missed the announcement and description of this section, you can read it here again.
It features 10 broadly diversified and sector ETFs from my HighVolume list as posted every Saturday. Furthermore, they are screened for the lowest MaxDD% number meaning they have been showing better resistance to temporary sell offs than all others over the past year.
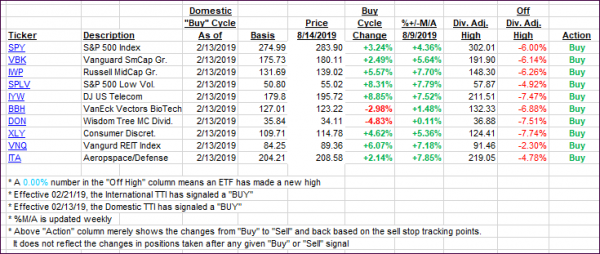
The below table simply demonstrates the magnitude with which some of the ETFs are fluctuating regarding their positions above or below their respective individual trend lines (%+/-M/A). A break below, represented by a negative number, shows weakness, while a break above, represented by a positive percentage, shows strength.
For hundreds of ETF choices, be sure to reference Thursday’s StatSheet.
For this current domestic “Buy” cycle, here’s how some our candidates have fared:

Again, the %+/-M/A column above shows the position of the various ETFs in relation to their respective long-term trend lines, while the trailing sell stops are being tracked in the “Off High” column. The “Action” column will signal a “Sell” once the -8% point has been taken out in the “Off High” column. For more volatile sector ETFs, the trigger point is -10%.
3. Trend Tracking Indexes (TTIs)
Our Trend Tracking Indexes (TTIs) took a dive, as markets collapsed. The Domestic one just stopped short of crossing its trend line to the downside, while the International one headed deeper into bearish territory.
The latter has now generated a ‘Sell’ signal, effective tomorrow. However, should the markets do an about face in the morning and rally sharply, I will hold off with the effective ‘Sell’ date for another day.
Here’s how we closed 08/14/2019:
Domestic TTI: +0.05% above its M/A (prior close +3.21%)—Buy signal effective 02/13/2019
International TTI: -2.39% below its M/A (prior close -0.36%)—Buy signal effective 06/19/2019
Disclosure: I am obliged to inform you that I, as well as my advisory clients, own some of the ETFs listed in the above table. Furthermore, they do not represent a specific investment recommendation for you, they merely show which ETFs from the universe I track are falling within the specified guidelines.
Contact Ulli