
ETF Tracker StatSheet
You can view the latest version here.
REBOUNDING INTO THE WEEKEND
- Moving the markets
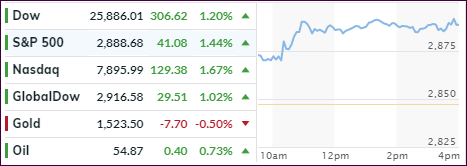
After yesterday’s lackluster session to nowhere, the markets found some upside momentum, with the ensuing relief rally reducing some of the losses sustained on Wednesday.
Trying to calm matters was St. Louis Fed President Bullard’s remarks that inter-meeting action would not be necessary, referring to the fact that there is no Fed meeting in August, and that a couple of weeks one way or the other won’t matter.
Then this gag order hit the wires: Fed Chair Powell has banned any public appearances by any Fed Board member, noting that “appearances at conferences have been canceled, all scheduled interviews have been abandoned and any comments on or off the record are outlawed.”
One analyst interpreted this unprecedented action as a reflection of two pressures:
First, economic indicators increasingly suggest the US is heading into a recession with the Dow plunging 800 points on Wednesday.
Second, relations with the White House have reached a new low, with president Trump pinning the success of his presidency upon a strong economy as a recession – Trump believes – would destroy his reputation and kill his reelection chances. As a result, Trump has – correctly – blamed the current woeful state of the global economy on the Fed. The problem is that Trump also “owned” the same state of both the economy and the market for the past two years, so any recession will be entirely his, just as Yellen (and Bernanke) intended, and shift attention away from the Fed.
On the economic side, data was dire, maybe that’s why markets rallied, as Consumer Confidence crashed in August to 92.1 from 98.4 missing all forecasts as per Bloomberg’s survey of economists. Then Housing Starts plunged by a whopping 4.0% MoM and missing expectations for a 0.2% rise. And that despite tumbling interest rates and rising mortgage applications
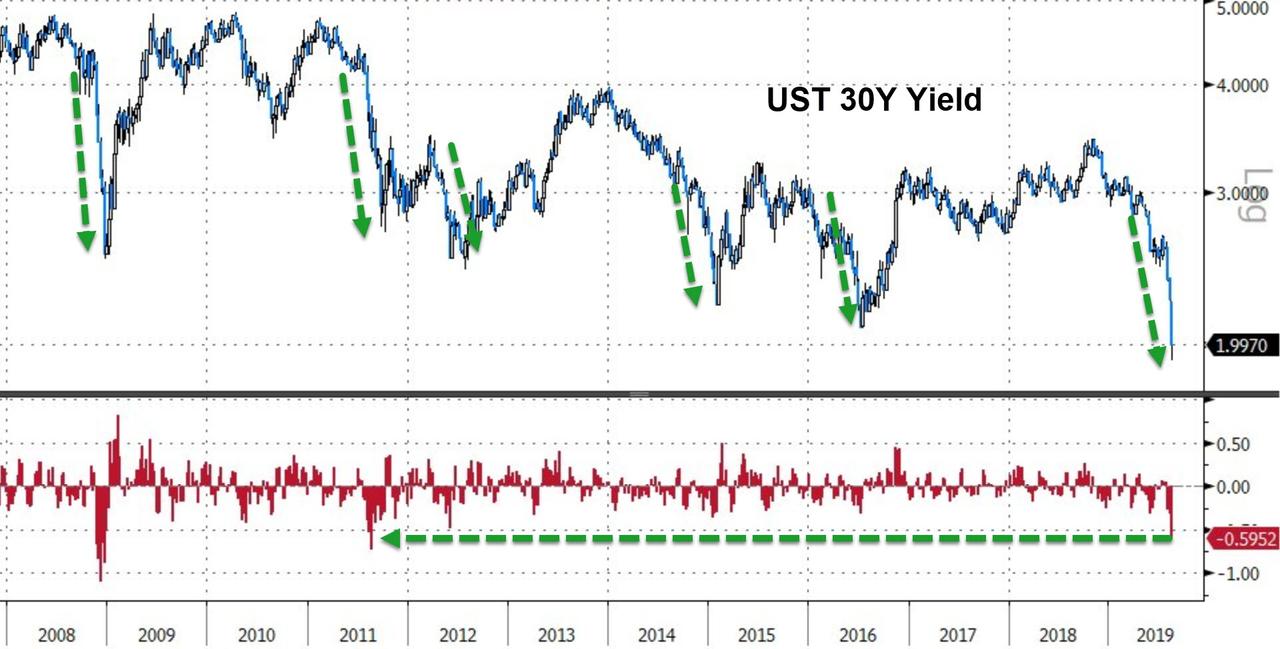
But the story of the week was bond yields, with the 30-year seeing its biggest crash since August 2011, as it fell to a record low and crossed the 2% level to the downside. As I posted before, the race to the bottom is on, and lower rates appear to be on the menu, with now $17 trillion of global bonds being negative. It’s only a matter of time until we get there as well.
That is, unless a Black Swan event suddenly reverses that trend and catapults yields considerably higher. It looks to me that volatility and uncertainty will be with us in the foreseeable future.
2. ETFs in the Spotlight
In case you missed the announcement and description of this section, you can read it here again.
It features 10 broadly diversified and sector ETFs from my HighVolume list as posted every Saturday. Furthermore, they are screened for the lowest MaxDD% number meaning they have been showing better resistance to temporary sell offs than all others over the past year.
The below table simply demonstrates the magnitude with which some of the ETFs are fluctuating regarding their positions above or below their respective individual trend lines (%+/-M/A). A break below, represented by a negative number, shows weakness, while a break above, represented by a positive percentage, shows strength.
For hundreds of ETF choices, be sure to reference Thursday’s StatSheet.
For this current domestic “Buy” cycle, here’s how some our candidates have fared:
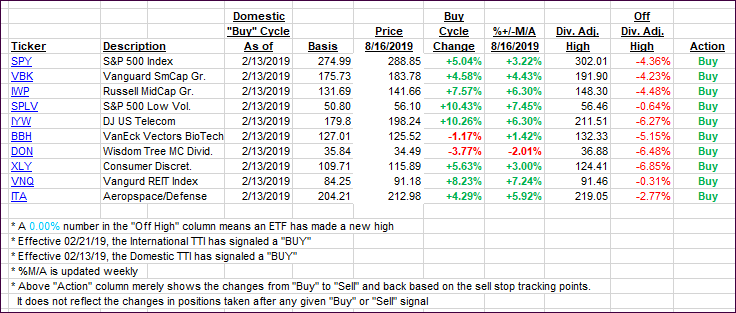
Again, the %+/-M/A column above shows the position of the various ETFs in relation to their respective long-term trend lines, while the trailing sell stops are being tracked in the “Off High” column. The “Action” column will signal a “Sell” once the -8% point has been taken out in the “Off High” column. For more volatile sector ETFs, the trigger point is -10%.
3 Trend Tracking Indexes (TTIs)
Our Trend Tracking Indexes (TTIs) improved, with the Domestic one shying away from a potential ‘Sell’ signal for the time being.
Here’s how we closed 08/16/2019:
Domestic TTI: +1.59% above its M/A (prior close +0.08%)—Buy signal effective 02/13/2019
International TTI: -1.56% below its M/A (prior close -2.79%)—Sell signal effective 08/15/2019
Disclosure: I am obliged to inform you that I, as well as my advisory clients, own some of the ETFs listed in the above table. Furthermore, they do not represent a specific investment recommendation for you, they merely show which ETFs from the universe I track are falling within the specified guidelines.
———————————————————-
WOULD YOU LIKE TO HAVE YOUR INVESTMENTS PROFESSIONALLY MANAGED?
Do you have the time to follow our investment plans yourself? If you are a busy professional who would like to have his portfolio managed using our methodology, please contact me directly or get more details here.
———————————————————
Back issues of the ETF Tracker are available on the web.
Contact Ulli