
- Moving the markets
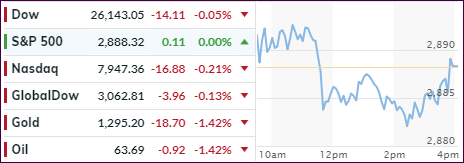
The S&P 500 came within a few points of touching its 2,900 level, but lack of follow through momentum pulled the major indexes off the highs and below the unchanged lines before a rebound limited the damage. The retreat occurred as uneasiness prevailed amongst traders in view of the upcoming earnings season, which kicks off unofficially on Friday.
Analysts have projected S&P 500 earnings to drop -4.2% YoY leaving the big boys on Wall Street a little wary before reviewing not only the latest results but also managements’ outlook for the next 12 months. Until those facts become known, we may see more of the directionless meandering of the indexes, as we witnessed today.
Another fly in the ointment could be the signs of lackluster growth throughout world economies, which may deflate the bullish craving despite the indexes hovering near all-time highs. I think, the markets need a solid driver to push through overhead resistance levels, and meager earnings may simply not be enough.
On the other hand, focused jawboning about the latest and greatest U.S.-China trade talks, along with the Fed uttering more dovish comments might be enough to take out the old highs.
Seems like economic adviser Kudlow took the lead by proclaiming that “I don’t see rates rising again in my lifetime,” which to me indicates that a recession is built in the cake and will have to be dealt with sooner or later. After all, rising interest rates are a sign of a strong economy and not a weak one, while low rates indicate the reverse.
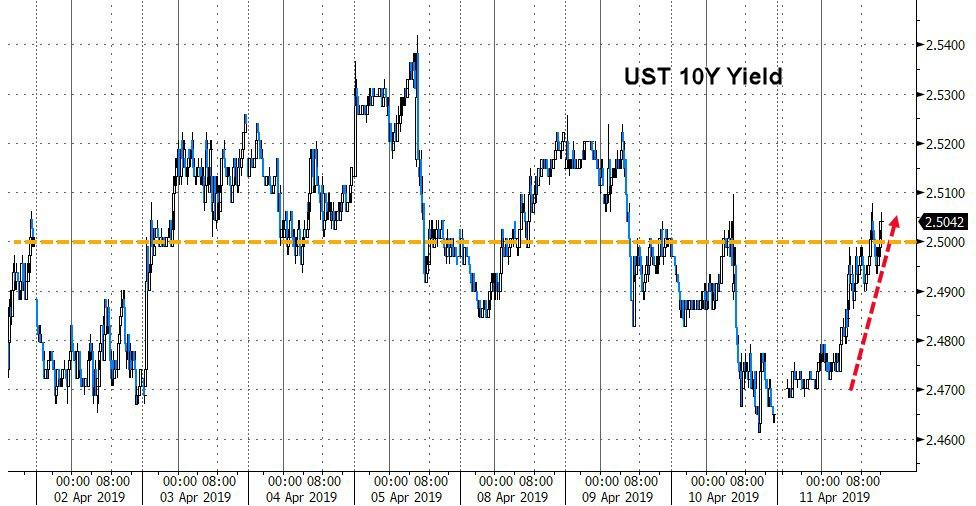
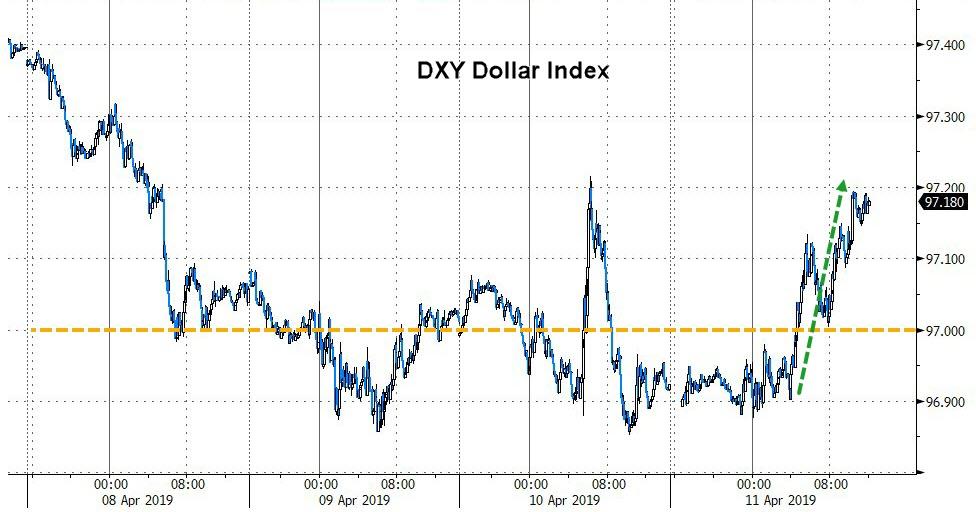
Speaking of reverse, today interest rates rose with the 10-year bond yield having now recaptured the 2.50% level, which helped the dollar index to break its 3-day losing streak.
- ETFs in the Spotlight
In case you missed the announcement and description of this section, you can read it here again.
It features 10 broadly diversified and sector ETFs from my HighVolume list as posted every Saturday. Furthermore, they are screened for the lowest MaxDD% number meaning they have been showing better resistance to temporary sell offs than all others over the past year.
The below table simply demonstrates the magnitude with which some of the ETFs are fluctuating regarding their positions above or below their respective individual trend lines (%+/-M/A). A break below, represented by a negative number, shows weakness, while a break above, represented by a positive percentage, shows strength.
For hundreds of ETF choices, be sure to reference Thursday’s StatSheet.
For this current domestic “Buy” cycle, here’s how some our candidates have fared:
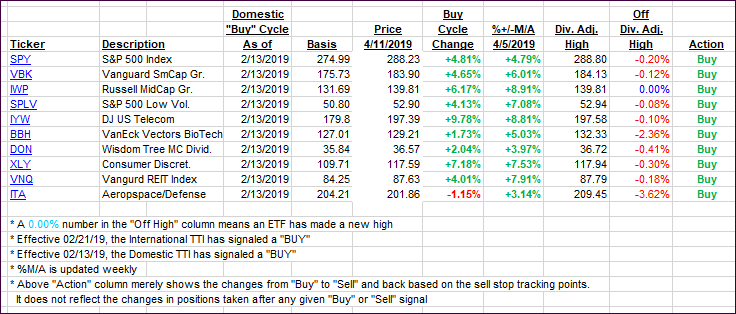
Again, the %+/-M/A column above shows the position of the various ETFs in relation to their respective long-term trend lines, while the trailing sell stops are being tracked in the “Off High” column. The “Action” column will signal a “Sell” once the -8% point has been taken out in the “Off High” column. For more volatile sector ETFs, the trigger point is -10%.
- Trend Tracking Indexes (TTIs)
Our Trend Tracking Indexes (TTIs) closed mixed with the Domestic one advancing while the International one slipped a bit.
Here’s how we closed 04/11/2019:
Domestic TTI: +5.90% above its M/A (last close +5.77%)—Buy signal effective 02/13/2019
International TTI: +3.26% above its M/A (last close +3.43%)—Buy signal effective 02/21/2019
Disclosure: I am obliged to inform you that I, as well as my advisory clients, own some of the ETFs listed in the above table. Furthermore, they do not represent a specific investment recommendation for you, they merely show which ETFs from the universe I track are falling within the specified guidelines.
Contact Ulli