- Moving the markets
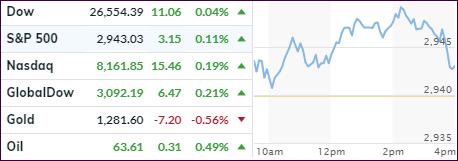
While the major indexes closed in the green to start the week, the gains were minor despite the Nasdaq scoring back to back record closes. The S&P 500 managed to notch a new intra-day high but slipped into the close barely finding support above the unchanged line.
The index has now reached an extremely overbought level, the most since January 2018, which was a moment in time that signaled an upcoming sudden and sharp correction. Complacency is high with VIX showing record short positions, which means traders are betting on a continued stream of low volatility. That is absolute insane and will not end well, as markets can turn suddenly and violently when extreme levels are reached.
Rising rates pulled interest rate sensitive sectors, such as low volatility equity and Real Estate ETFs a little lower, with the US Dollar joining the party and losing some of its luster as well, although the slide was modest.
On the economic front, we saw that consumer spending jumped 0.9% in March, its largest monthly gain in almost 10 years. Allegedly, core inflation weakened, leading traders to conclude that the Fed will not yet be motivated to change its interest rate policy.
Yet, at the same time, the US savings rate plunged, while YoY spending has accelerated beyond income growth. Yes, that is only possible because of the never-ending use of credit.
Go figure…
- ETFs in the Spotlight
In case you missed the announcement and description of this section, you can read it here again.
It features 10 broadly diversified and sector ETFs from my HighVolume list as posted every Saturday. Furthermore, they are screened for the lowest MaxDD% number meaning they have been showing better resistance to temporary sell offs than all others over the past year.
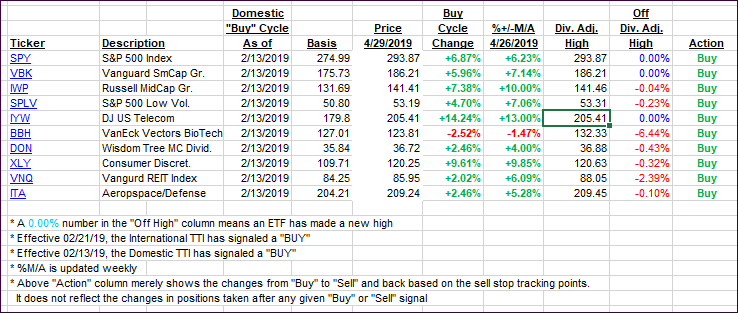
The below table simply demonstrates the magnitude with which some of the ETFs are fluctuating regarding their positions above or below their respective individual trend lines (%+/-M/A). A break below, represented by a negative number, shows weakness, while a break above, represented by a positive percentage, shows strength.
For hundreds of ETF choices, be sure to reference Thursday’s StatSheet.
For this current domestic “Buy” cycle, here’s how some our candidates have fared:
Again, the %+/-M/A column above shows the position of the various ETFs in relation to their respective long-term trend lines, while the trailing sell stops are being tracked in the “Off High” column. The “Action” column will signal a “Sell” once the -8% point has been taken out in the “Off High” column. For more volatile sector ETFs, the trigger point is -10%.
- Trend Tracking Indexes (TTIs)
Our Trend Tracking Indexes (TTIs) were mixed with the International one taking a jump deeper into bullish territory.
Here’s how we closed 04/29/2019:
Domestic TTI: +6.44% above its M/A (last close +6.45%)—Buy signal effective 02/13/2019
International TTI: +4.15% above its M/A (last close +3.89%)—Buy signal effective 02/21/2019
Disclosure: I am obliged to inform you that I, as well as my advisory clients, own some of the ETFs listed in the above table. Furthermore, they do not represent a specific investment recommendation for you, they merely show which ETFs from the universe I track are falling within the specified guidelines.
Contact Ulli

