
- Moving the markets
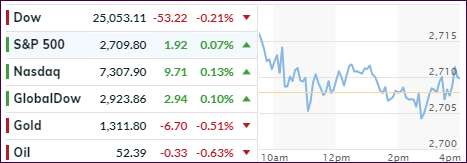
It was choppy trading session with the major indexes hugging their respective trend lines throughout the day. Neither big dips nor strong rallies were to be seen anywhere, as momentum in either direction was conspicuously absent.
Part of this uncertainty may have been caused by a winding down of the earnings season and nervousness about a flood of important data points scheduled to be published later this week. On deck, we have the U.S. CPI index and a look at the Q4 GDP in Germany, which is suspected to confirm a slowdown in activity.
This is followed by releases of trade, credit and CPI data in China, as well as GDP in the U.K., while the wait for Brexit goes on. Other headlines suggest a U.S. government shutdown as early as Friday, until which time we will still be facing the remainder of the earnings releases.
In the end, it was a mixed day that had no effect on our current view that we need to have more upside confirmation to generate a new domestic ‘Buy’ signal.
- ETFs in the Spotlight
In case you missed the announcement and description of this section, you can read it here again.
It features 10 broadly diversified and sector ETFs from my HighVolume list as posted every Saturday. Furthermore, they are screened for the lowest MaxDD% number meaning they have been showing better resistance to temporary sell offs than all others over the past year.
The below table simply demonstrates the magnitude with which some of the ETFs are fluctuating regarding their positions above or below their respective individual trend lines (%M/A). A break below, represented by a negative number, shows weakness, while a break above, represented by a positive percentage, shows strength.
For hundreds of ETF choices, be sure to reference Thursday’s StatSheet.
Year to date, here’s how our original candidates from the last cycle have fared:
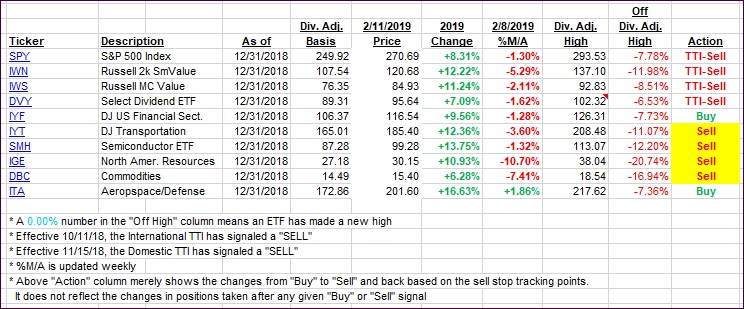
Again, the %M/A column above shows the position of the various ETFs in relation to their respective long-term trend lines, while the trailing sell stops are being tracked in the “Off High” column. The “Action” column will signal a “Sell” once the -8% point has been taken out in the “Off High” column. For more volatile sector ETFs, the trigger point is -10%.
- Trend Tracking Indexes (TTIs)
Our Trend Tracking Indexes (TTIs) improved a tad but not enough to generate a new ‘Buy’ signal for the Domestic TTI.
Here’s how we closed 02/11/2019:
Domestic TTI: +0.39% below its M/A (last close +0.11%)—Sell signal effective 11/15/2018
International TTI: -1.62% below its M/A (last close -1.73%)—Sell signal effective 10/11/2018
Disclosure: I am obliged to inform you that I, as well as my advisory clients, own some of the ETFs listed in the above table. Furthermore, they do not represent a specific investment recommendation for you, they merely show which ETFs from the universe I track are falling.
Contact Ulli