
- Moving the markets
I guess nothing can ever really satisfy the traders/algos on Wall Street, who constantly need to be fed a fresh dose of stimulus in order to maintain the bullish mood. Apparently, it’s not enough that the Fed threw in the towel by doing a U-turn with their interest rate policy and in the process becoming Wall Street’s lapdog.
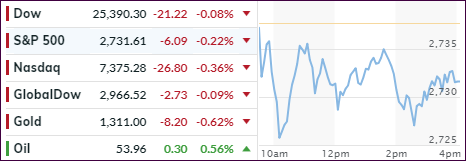
So, much was expected from the State of the Union address in terms of new details on the economic agenda or a concrete solution to the China trade disagreements. With no specifics forthcoming, the markets slipped a bit with the major indexes closing in the red by a small margin for the first time in 6 sessions.
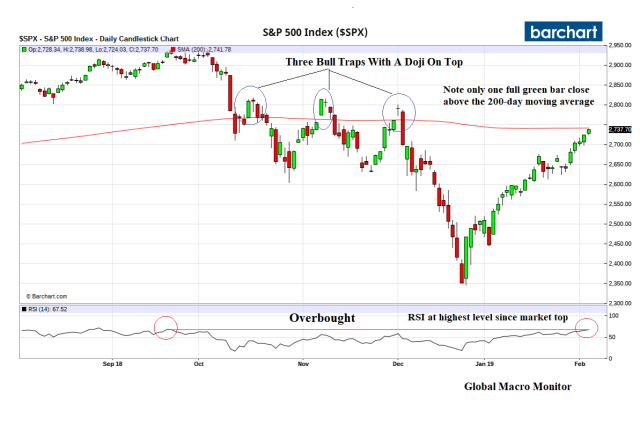
Technically speaking, the S&P 500 is facing stiff overhead resistance as it approaches its 200-day M/A. As of today, it’s only 12 points away from cracking this barrier and moving back onto the bullish side. For the second day in a row, the index was unable to make the break.
However, once it conquers that line, it’s not a guarantee that it will be free sailing from then on. As this chart shows (courtesy of Global Market Monitor), the last 3 times this occurred, it turned into a regrettable head fake that head the bears chomping at the bit.
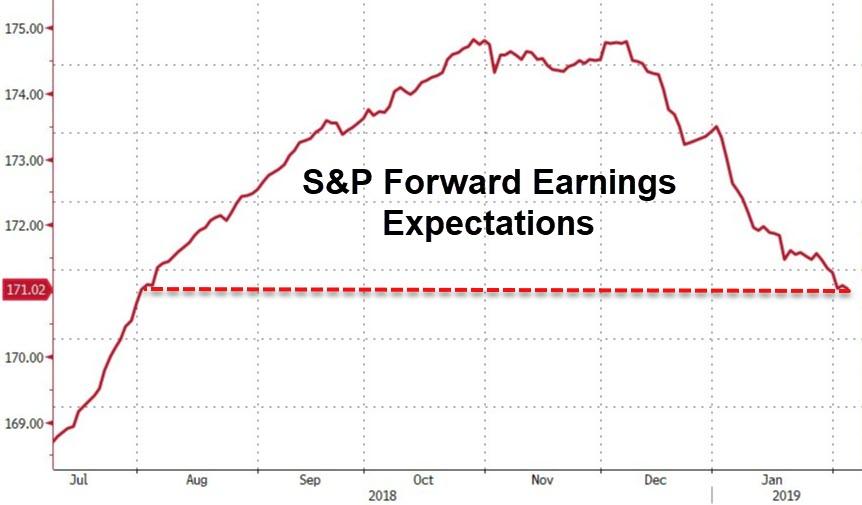
To me, the markets seem out of touch with reality, especially when considering that earnings are one of the main economic drivers that attempt to justify the current lofty levels. Forward earning expectations continue to slip and have now crashed to a 6-month low. Go figure…
Our Trend Tracking Indexes (TTIs) retreaded a tad, but the Domestic one remains above its long-term trend line. A little more staying power is needed, before I will issue a new Domestic ‘Buy’ signal.
- ETFs in the Spotlight
In case you missed the announcement and description of this section, you can read it here again.
It features 10 broadly diversified and sector ETFs from my HighVolume list as posted every Saturday. Furthermore, they are screened for the lowest MaxDD% number meaning they have been showing better resistance to temporary sell offs than all others over the past year.
The below table simply demonstrates the magnitude with which some of the ETFs are fluctuating regarding their positions above or below their respective individual trend lines (%M/A). A break below, represented by a negative number, shows weakness, while a break above, represented by a positive percentage, shows strength.
For hundreds of ETF choices, be sure to reference Thursday’s StatSheet.
Year to date, here’s how our original candidates from the last cycle have fared:
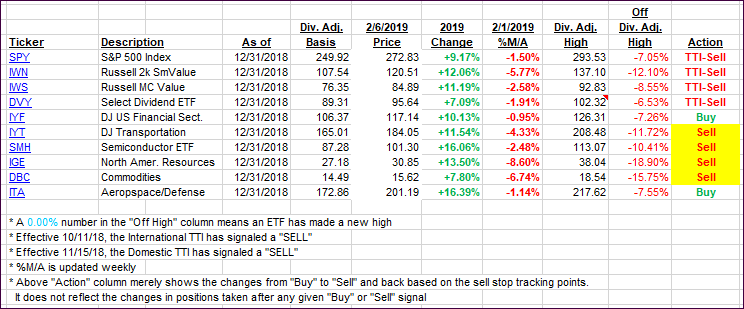
Again, the %M/A column above shows the position of the various ETFs in relation to their respective long-term trend lines, while the trailing sell stops are being tracked in the “Off High” column. The “Action” column will signal a “Sell” once the -8% point has been taken out in the “Off High” column. For more volatile sector ETFs, the trigger point is -10%.
- Trend Tracking Indexes (TTIs)
Our Trend Tracking Indexes (TTIs) slipped a tad with the Domestic one remaining on the bullish side of its trend line and on deck for generating a new ‘Buy’ signal.
Here’s how we closed 02/06/2019:
Domestic TTI: +0.65% below its M/A (last close +0.74%)—Sell signal effective 11/15/2018
International TTI: -0.34% below its M/A (last close -0.25%)—Sell signal effective 10/11/2018
Disclosure: I am obliged to inform you that I, as well as my advisory clients, own some of the ETFs listed in the above table. Furthermore, they do not represent a specific investment recommendation for you, they merely show which ETFs from the universe I track are falling.
Contact Ulli