
- Moving the markets
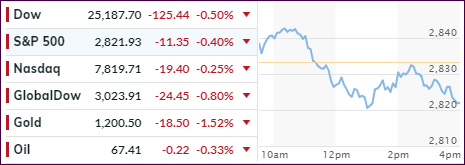
Despite the US not having much direct financial exposure in Turley, its ongoing troubles did stop investors in their tracks. That simply means risk assets, such as equities, fell out of favor today, and the major indexes headed south wiping out some early gains and ending in the red.
After all, no direct exposure does not mean, the US is isolated—far from it. In the simplest terms, these days most countries are connected at the hip. For example, European banks are heavily exposed to Turkish debt and in turn, US banks are holders of European debt. If any domino falls, the subsequent effect will surely travel across the Atlantic in a hurry.
The Turkish Central Bank went all out and declared to provide “all the liquidity the banks need,” but fell short of announcing a hike in interest rates. So, the lira continued to tumble, and raised concerns that this could ripple through the emerging markets economies first, and then who knows who’s next.
Emerging market currencies got pummeled again as the US Dollar climbed relentlessly for the 3rd day in a row to spike to its highest since June 2017. This also affected commodities with DBC losing -0.53%.
With the US/China trade wars having been shoved in the background for the moment, but still very much alive, and the emerging markets pandemonium in full swing, we seem to be going through a crisis phase, which could keep equities in check until a more positive theme develops. On the other hand, it is entirely possible that these current events, along with subsequent developments, can spell the end of the this very extended market cycle.
Since no one has the answer, we’ll go along for the ride until our Trend Tracking Indexes (TTIs) give the signal to step aside.
- ETFs in the Spotlight
In case you missed the announcement and description of this section, you can read it here again.
It features 10 broadly diversified and sector ETFs from my HighVolume list as posted every Saturday. Furthermore, they are screened for the lowest MaxDD% number meaning they have been showing better resistance to temporary sell offs than all others over the past year.
The below table simply demonstrates the magnitude with which some of the ETFs are fluctuating regarding their positions above or below their respective individual trend lines (%M/A). A break below, represented by a negative number, shows weakness, while a break above, represented by a positive percentage, shows strength.
For hundreds of ETF choices, be sure to reference Thursday’s StatSheet.
Year to date, here’s how our candidates have fared so far:
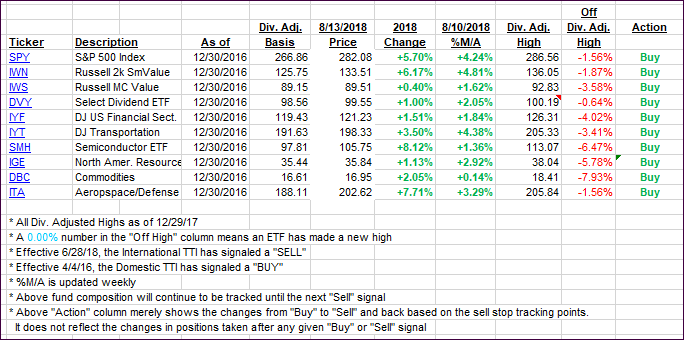
Again, the %M/A column above shows the position of the various ETFs in relation to their respective long-term trend lines, while the trailing sell stops are being tracked in the “Off High” column. The “Action” column will signal a “Sell” once the -8% point has been taken out in the “Off High” column. For more volatile sector ETFs, the trigger point is -10%.
- Trend Tracking Indexes (TTIs)
Our Trend Tracking Indexes (TTIs) pulled back with the International one slipping further into bear market territory. Since this is only its 2nd day below the line, I will hold off a while longer before declaring this “Buy” cycle to be over.
Here’s how we closed 08/13/2018:
Domestic TTI: +2.44% above its M/A (last close +2.56%)—Buy signal effective 4/4/2016
International TTI: -0.93% below its M/A (last close -0.37%)—Buy signal effective 7/26/2018
Disclosure: I am obliged to inform you that I, as well as my advisory clients, own some of the ETFs listed in the above table. Furthermore, they do not represent a specific investment recommendation for you, they merely show which ETFs from the universe I track are falling within the guidelines specified.
Contact Ulli