
ETF Tracker StatSheet
TURKEY RATTLES THE EQUITY CAGE
- Moving the markets
As I mentioned yesterday, “domestic equity markets have note priced in any long-term consequences of a prolonged trade war with China, reeling emerging markets and European banking problems.” This came true today at least regarding one emerging market, namely Turkey, which has been dealing with a mounting currency crisis for quite some time.
The Turkish Lira plunged to a record low of 6.3005 per dollar making it the worst performing emerging market currency in 2018, while their 10-year bond yield catapulted to a new record high of 20.67%. The Lira is down 20% for the week and 40% YTD. Fears of contagion spread in a hurry, as mostly European banks have some 40% exposure of the Turkish banking sector assets.
Even though US banks have only limited involvement, this kind of international turmoil is bound to send shivers around the world and waking up investors to the fact that all may not be well. After all, no country is isolated enough to disregard and not be affected by events in global economies and/or foreign currencies, especially if the latter just had their worst week since 2011.
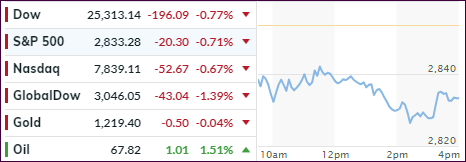
That’s all it took to put the bears in charge and south we went. Domestically, the major indexes lost about 0.75% and managed to stage a comeback late in the session, which was not enough to produce green numbers.
Not helping matters was volatility in Russian markets with the Ruble dropping some 5% to 27-month lows against the US dollar, after their stock indexes dove as much as 9% on Thursday. This was the result of newly announced US sanctions.
With all the currency destruction around the world, the US dollar benefited and surged for the week, while the 10-year Treasury yield dropped 6 basis points today to end at 2.87%, as the flight to safety was on.
I just don’t believe that this is the end of the emerging markets currency destruction. I am sure there will be more fallout to come. The questions are: “How far will it spread and to what degree will equity markets be affected?” “Is this just an outlier, and will we be back to ‘normal’ next week?”
Unfortunately, we will have to wait for the answers to not only develop but also be reflected in our Trend Tracking Indexes (TTIs) before taking evasive action.
- ETFs in the Spotlight
In case you missed the announcement and description of this section, you can read it here again.
It features 10 broadly diversified and sector ETFs from my HighVolume list as posted every Saturday. Furthermore, they are screened for the lowest MaxDD% number meaning they have been showing better resistance to temporary sell offs than all others over the past year.
The below table simply demonstrates the magnitude with which some of the ETFs are fluctuating regarding their positions above or below their respective individual trend lines (%M/A). A break below, represented by a negative number, shows weakness, while a break above, represented by a positive percentage, shows strength.
For hundreds of ETF choices, be sure to reference Thursday’s StatSheet.
Year to date, here’s how our candidates have fared so far:
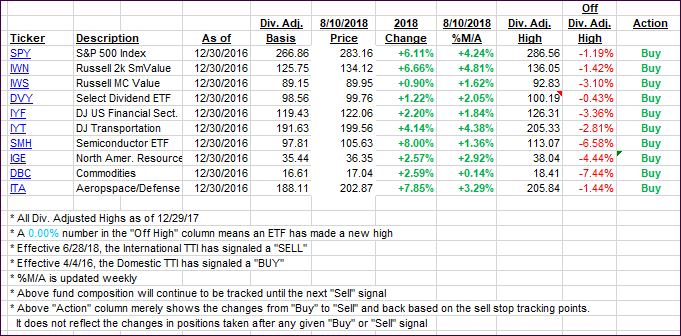
Again, the %M/A column above shows the position of the various ETFs in relation to their respective long-term trend lines, while the trailing sell stops are being tracked in the “Off High” column. The “Action” column will signal a “Sell” once the -8% point has been taken out in the “Off High” column. For more volatile sector ETFs, the trigger point is -10%.
- Trend Tracking Indexes (TTIs)
Our Trend Tracking Indexes (TTIs) stumbled with the International one getting crushed and pushed back below its trend line. With the increased volatility and sudden change in direction, I will wait to make sure this break below will hold before announcing this current “Buy” signal to be over.
Here’s how we closed 08/10/2018:
Domestic TTI: +2.56% above its M/A (last close +2.94%)—Buy signal effective 4/4/2016
International TTI: -0.37% below its M/A (last close +0.89%)—Buy signal effective 7/26/2018
Disclosure: I am obliged to inform you that I, as well as my advisory clients, own some of the ETFs listed in the above table. Furthermore, they do not represent a specific investment recommendation for you, they merely show which ETFs from the universe I track are falling within the guidelines specified.
————————————————————-
READER Q & As
All Reader Q & A’s are listed at our web site!
Check it out at:
https://theetfbully.com/questions-answers/
———————————————————-
WOULD YOU LIKE TO HAVE YOUR INVESTMENTS PROFESSIONALLY MANAGED?
Do you have the time to follow our investment plans yourself? If you are a busy professional who would like to have his portfolio managed using our methodology, please contact me directly or get more details at:
https://theetfbully.com/personal-investment-management/
———————————————————
Back issues of the ETF/No Load Fund Tracker are available on the web at:
https://theetfbully.com/newsletter-archives/
Contact Ulli