
- Moving the markets
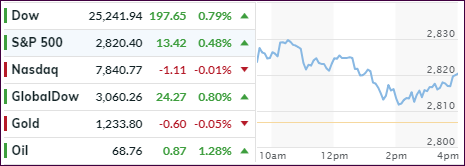
Something odd is going on in the markets besides the Chinese Yuan having crashed more in the last 30 days than at anytime in history not counting the 2008 Great Financial Crisis. Yesterday, it was the sudden 10-year bond yield spike to its highest level in 5 months.
Today, it was a huge reversal in the Nasdaq, which had advanced some 1.1% intraday early on to a new record high, but these solid gains evaporated, and the index limped below the unchanged line by -0.01%. Even Google’s “beat” and subsequent rally could not stem the slide. Strangely enough, the Dow and S&P 500 were not affected at all and closed with decent gains.
Transportations (IYT) gave back some of their recent advances, and the Commodity Index (DBC) rallied because of a modestly weaker US Dollar. Activity in the 10-year bond yield slowed down from yesterday’s hectic pace, and the yield perked up 1 basis point to 2.95%.
Volatility and wild unexpected swings in different asset classes appear to be here to stay making me wonder not only as to “who’s next?” but also “will there be spillover effects?” Only time will tell.
- ETFs in the Spotlight
In case you missed the announcement and description of this section, you can read it here again.
It features 10 broadly diversified and sector ETFs from my HighVolume list as posted every Saturday. Furthermore, they are screened for the lowest MaxDD% number meaning they have been showing better resistance to temporary sell offs than all others over the past year.
The below table simply demonstrates the magnitude with which some of the ETFs are fluctuating regarding their positions above or below their respective individual trend lines (%M/A). A break below, represented by a negative number, shows weakness, while a break above, represented by a positive percentage, shows strength.
For hundreds of ETF choices, be sure to reference Thursday’s StatSheet.
Year to date, here’s how our candidates have fared so far:
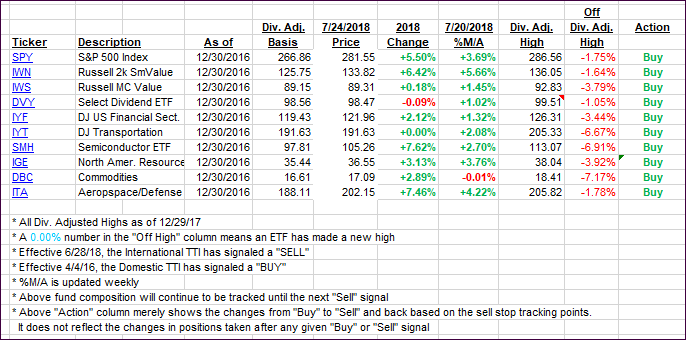
Again, the %M/A column above shows the position of the various ETFs in relation to their respective long-term trend lines, while the trailing sell stops are being tracked in the “Off High” column. The “Action” column will signal a “Sell” once the -8% point has been taken out in the “Off High” column. For more volatile sector ETFs, the trigger point is -10%.
- Trend Tracking Indexes (TTIs)
Our Trend Tracking Indexes (TTIs) both rallied with the International one showing more strength, at least for today.
Here’s how we closed 07/24/2018:
Domestic TTI: +2.80% above its M/A (last close +2.74%)—Buy signal effective 4/4/2016
International TTI: +0.96% above its M/A (last close +0.39%)—Sell signal effective 6/28/2018
Disclosure: I am obliged to inform you that I, as well as my advisory clients, own some of the ETFs listed in the above table. Furthermore, they do not represent a specific investment recommendation for you, they merely show which ETFs from the universe I track are falling within the guidelines specified.
Contact Ulli