
- Moving the markets
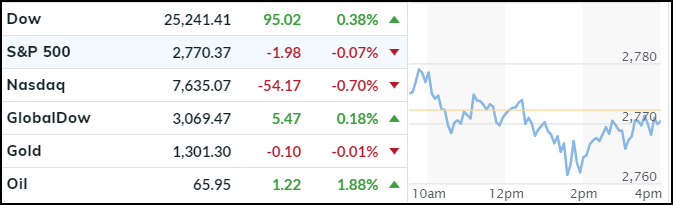
After the 4-day winning streak, we saw a slight pullback in the major indexes, especially in the tech sector, with the Nasdaq giving back a modest -0.70%. However, the main action happened in the bond market.
Following the recent rise in yields towards the psychologically important 3% level, for the 10-year bond, the rally turned around suddenly with yields flash-crashing 10-12 basis points, as this chart shows. That’s a huge move forcing those with short positions to run for cover.
With Italy being out of the limelight today, Brazil took its place in the spotlight. Turmoil best describes the events of the day, with the Brazilian Real crashing to a new low as a $3 billion-dollar intervention failed to prop up markets. It sure looked like there was an “unmistakable relationship between the timing of the Real’s plunge and the collapse in Treasury yields,” according to ZeroHedge.
There are so many hotspots in the world right now with any of them being able to affect markets worldwide. It’s somewhat surprising that the major indexes continue to climb a wall worry, in the process ignoring any theme that can’t be interpreted as bullish.
- ETFs in the Spotlight
In case you missed the announcement and description of this section, you can read it here again.
It features 10 broadly diversified and sector ETFs from my HighVolume list as posted every Saturday. Furthermore, they are screened for the lowest MaxDD% number meaning they have been showing better resistance to temporary sell offs than all others over the past year.
The below table simply demonstrates the magnitude with which some of the ETFs are fluctuating regarding their positions above or below their respective individual trend lines (%M/A). A break below, represented by a negative number, shows weakness, while a break above, represented by a positive percentage, shows strength.
For hundreds of ETF choices, be sure to reference Thursday’s StatSheet.
Year to date, here’s how our candidates have fared so far:
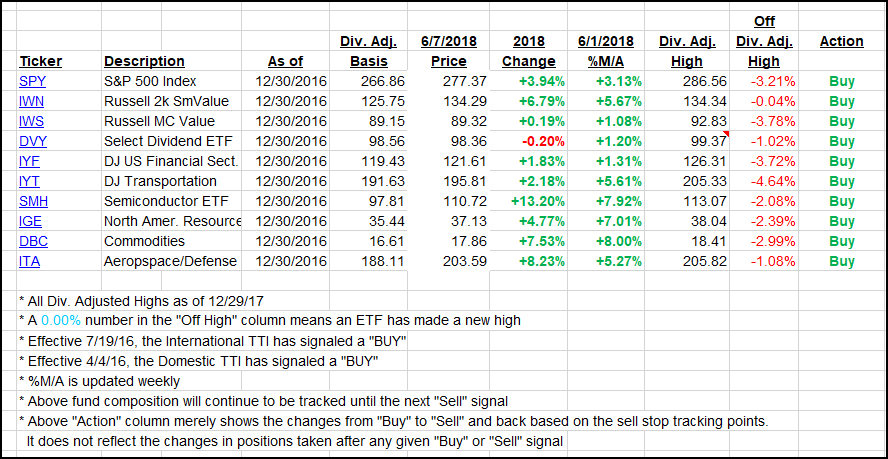
Again, the %M/A column above shows the position of the various ETFs in relation to their respective long-term trend lines, while the trailing sell stops are being tracked in the “Off High” column. The “Action” column will signal a “Sell” once the -7.5% point has been taken out in the “Off High” column.
- Trend Tracking Indexes (TTIs)
Our Trend Tracking Indexes (TTIs) were mixed as markets were treading water.
Here’s how we closed 06/07/2018:
Domestic TTI: +2.68% above its M/A (last close +2.82%)—Buy signal effective 4/4/2016
International TTI: +2.00% below its M/A (last close +1.93%)—Buy signal effective 7/19/2016
Disclosure: I am obliged to inform you that I, as well as my advisory clients, own some of the ETFs listed in the above table. Furthermore, they do not represent a specific investment recommendation for you, they merely show which ETFs from the universe I track are falling within the guidelines specified.
Contact Ulli