
- Moving the markets
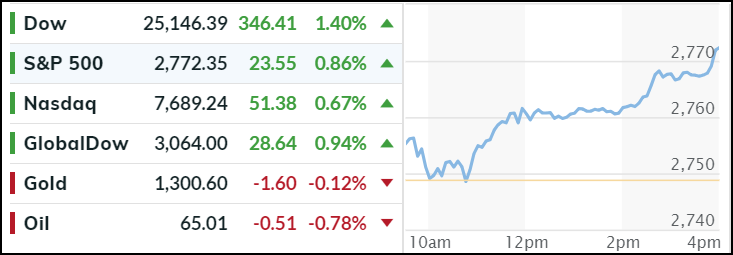
After an early morning pullback, the floodgates opened with buyers appearing in full force and pushing the major indexes higher with the Nasdaq closing at another record, while the Dow sported its best day in almost 2 months.
Since there were no news to justify the run-up, the VIX was pushed down to an 11 handle thereby throwing a solid assist to keep the bullish movement going. Remember, a lower VIX supports equities and vice versa. On the other hand, this reckless exuberance is not shared by those who allegedly know best, namely the Smart Money. This chart makes that abundantly clear.
Despite the Nasdaq’s solid performance (+0.67%), the Financials did even better with XLF adding +1.86%. A higher 10-year bond yield boosted that sector along with encouraging remarks from the ECB regarding them being on track to end their asset purchases.
The ongoing trade battle, Italian political and banking tensions along with Deutsche Bank’s financial issues were pretty much ignored, as the bulls continued to have it their way for the 4th day straight day.
- ETFs in the Spotlight
In case you missed the announcement and description of this section, you can read it here again.
It features 10 broadly diversified and sector ETFs from my HighVolume list as posted every Saturday. Furthermore, they are screened for the lowest MaxDD% number meaning they have been showing better resistance to temporary sell offs than all others over the past year.
The below table simply demonstrates the magnitude with which some of the ETFs are fluctuating regarding their positions above or below their respective individual trend lines (%M/A). A break below, represented by a negative number, shows weakness, while a break above, represented by a positive percentage, shows strength.
For hundreds of ETF choices, be sure to reference Thursday’s StatSheet.
Year to date, here’s how our candidates have fared so far:
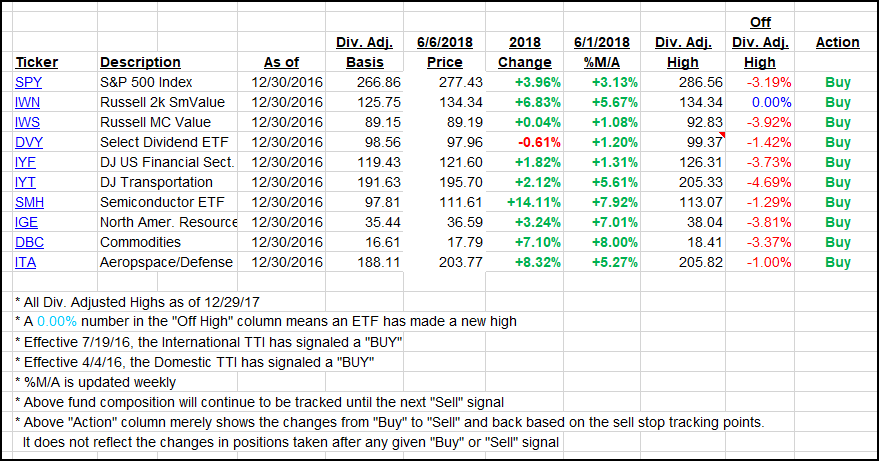
Again, the %M/A column above shows the position of the various ETFs in relation to their respective long-term trend lines, while the trailing sell stops are being tracked in the “Off High” column. The “Action” column will signal a “Sell” once the -7.5% point has been taken out in the “Off High” column.
- Trend Tracking Indexes (TTIs)
Our Trend Tracking Indexes (TTIs) joined the major indexes and moved deeper into bullish territory.
Here’s how we closed 06/06/2018:
Domestic TTI: +2.82% above its M/A (last close +2.48%)—Buy signal effective 4/4/2016
International TTI: +1.93% below its M/A (last close +1.36%)—Buy signal effective 7/19/2016
Disclosure: I am obliged to inform you that I, as well as my advisory clients, own some of the ETFs listed in the above table. Furthermore, they do not represent a specific investment recommendation for you, they merely show which ETFs from the universe I track are falling within the guidelines specified.
Contact Ulli