
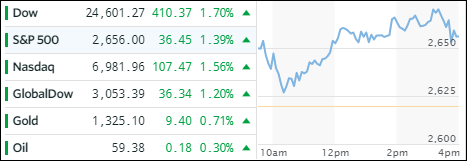
- Moving the markets
Volatility continued today although not much was visible during the regular session. ZH remarked:
Having been up almost 400 points from its Friday cash close, Dow futures plunged back into the red, amid chaotic swings and the lowest market liquidity ever seen. But that did not last as the machines dragged stocks back up – The Dow up over 500 points to a 50% retrace of its Volocaust losses… before running out of steam…
In other words, we are still in the middle of chaotic conditions where anything can happen as witnessed by the “Fear-and-Greed” index whose needle remains stuck at “Extreme Fear.” It will take a little time to evaluate if the VIX is just taking a break to come back with a vengeance or if today’s upside follow through signals an end to the correction.
Markets headed higher supported by declining bond yields and a weaker dollar. The execution of our trailing sell stops last Friday affected about 55% of our ETF holdings, and we are participating in the current rally with the remaining 45%. I will increase those percentages as soon as I see some calmness return to the markets, which also likely means that bond yields will need to stop rising.
That was not the case today as the 10-year rose 3 basis points to 2.86% with inflation worries being on the forefront. In that regard, traders are eagerly awaiting Wednesday’s Consumer Price Index (for January), which is critical, as a higher than expected number will represent further inflationary tendencies, followed by higher interest rates and potentially a bearish effect on equities.
- ETFs in the Spotlight
In case you missed the announcement and description of this section, you can read it here again.
It features 10 broadly diversified and sector ETFs from my HighVolume list as posted every Saturday. Furthermore, they are screened for the lowest MaxDD% number meaning they have been showing better resistance to temporary sell offs than all others over the past year.
The below table simply demonstrates the magnitude with which some of the ETFs are fluctuating in regards to their positions above or below their respective individual trend lines (%M/A). A break below, represented by a negative number, shows weakness, while a break above, represented by a positive percentage, shows strength.
For hundreds of ETF choices, be sure to reference Thursday’s StatSheet.
Year to date, here’s how our candidates have fared so far:
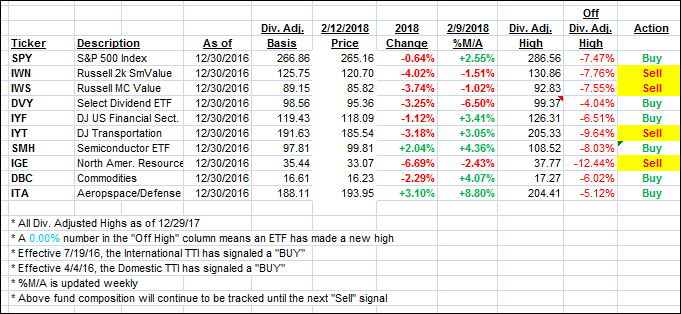
Again, the %M/A column above shows the position of the various ETFs in relation to their respective long term trend lines, while the trailing sell stops are being tracked in the “Off High” column. The “Action” column will signal a “Sell” once the -7.5% point has been taken out in the “Off High” column.
- Trend Tracking Indexes (TTIs)
Our Trend Tracking Indexes (TTIs) jumped as the markets stayed in rebound mode the entire session.
Here’s how we closed 2/12/2018:
Domestic TTI: +2.03% above its M/A (last close +1.48%)—Buy signal effective 4/4/2016
International TTI: +2.23% above its M/A (last close +1.21%)—Buy signal effective 7/19/2016
Disclosure: I am obliged to inform you that I, as well as my advisory clients, own some of the ETFs listed in the above table. Furthermore, they do not represent a specific investment recommendation for you, they merely show which ETFs from the universe I track are falling within the guidelines specified.
Contact Ulli