
- Moving the markets
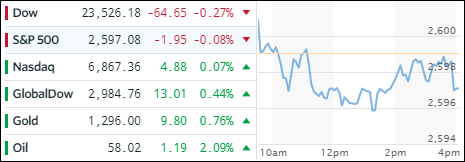
The major indexes presented a mixed picture with the Dow and S&P 500 slightly dipping while the Nasdaq managed to eke out another record—although a tiny one. The Fed minutes surprised traders in that they were very dovish (lower rates) ignoring inflation concerns with some officials opposing near-term rate hikes. That came as a surprise as a December increase was a foregone conclusion. Now we’ll have to wait and see if that will be reversed…
The more immediate result was that gold jumped and is again approaching its $1,300 glass ceiling. With the dovish stance of the Fed, the US dollar (UUP) dumped -0.78%, violating its 50-day M/A to the downside; it had its worst showing since early September. Interest rates dropped allowing the 20-year bond ETF (TLT) to rally +0.32% and reaching a level last seen 2 months ago.
In ETF space, we saw a mixed picture with winners and losers sharing center stage. International SmallCaps (SCHC) were in the limelight with a +0.49% gain followed by International Equities (SCHF) with a decent showing of +0.32%. On the downside, Semiconductors (SMH) gave back some of their huge YTD profits (-0.65%) while the Financials surrendered -0.49%.
This Friday, the markets will have an abbreviated session. In the meantime, I wish you a Happy Thanksgiving Holiday.
- ETFs in the Spotlight (updated for 2017)
In case you missed the announcement and description of this section, you can read it here again.
It features 10 broadly diversified and sector ETFs from my HighVolume list as posted every Saturday. Furthermore, they are screened for the lowest MaxDD% number meaning they have been showing better resistance to temporary sell offs than all others over the past year.
The below table simply demonstrates the magnitude with which some of the ETFs are fluctuating in regards to their positions above or below their respective individual trend lines (%M/A). A break below, represented by a negative number, shows weakness, while a break above, represented by a positive percentage, shows strength.
For hundreds of ETF choices, be sure to reference Thursday’s StatSheet.
Year to date, here’s how the 2017 candidates have fared so far:
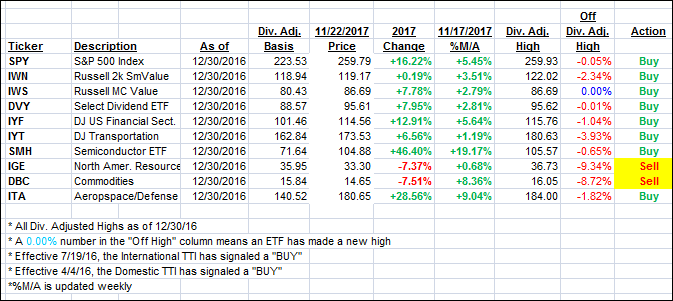
Again, the %M/A column above shows the position of the various ETFs in relation to their respective long term trend lines, while the trailing sell stops are being tracked in the “Off High” column. The “Action” column will signal a “Sell” once the -7.5% point has been taken out in the “Off High” column.
- Trend Tracking Indexes (TTIs)
Our Trend Tracking Indexes (TTIs) ended mixed as market direction was unclear.
Here’s how we closed 11/22/2017:
Domestic TTI: +3.41% above its M/A (last close +3.44%)—Buy signal effective 4/4/2016
International TTI: +6.18% above its M/A (last close +5.92%)—Buy signal effective 7/19/2016
Disclosure: I am obliged to inform you that I, as well as my advisory clients, own some of the ETFs listed in the above table. Furthermore, they do not represent a specific investment recommendation for you, they merely show which ETFs from the universe I track are falling within the guidelines specified.
Contact Ulli