
- Moving the Markets
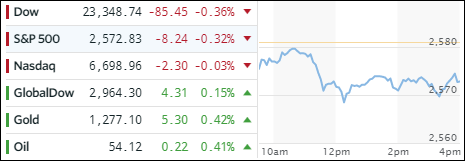
Equities struggled with only the Nasdaq managing to spend some time above the unchanged line early on, and knocking out another intra-day record, but it too succumbed to weakness, before sliding slightly into the red.
Trump’s tax cuts were at the center of the market weakness, as the House was discussing a more “gradual phase-in for the corporate tax-rate cut,” against the President’s plan for an immediate reduction. Any danger of sudden changes being implemented is bound to affect markets, as the tax-cut has formed the base for recent market advances.
As uncertainty reigned, the ETF space was affected as well, and we saw more red numbers than green ones. Closing the session on a positive note were International SmallCaps (SCHC) and International Equities (SCHF) with gains of +0.70% and +0.24% respectively. On the downside, Transportations (IYT) took the biggest hit with -1.31% followed by US SmallCaps with -0.85%.
Interest rates headed south as the yield on the 10-year bond took a dive by losing 5 basis points to end at 2.37%, which helped the 20-year bond price (TLT) to finally show signs of life again by rallying +0.96%. The US dollar (UUP) headed the other way and lost -0.49%.
- ETFs in the Spotlight (updated for 2017)
In case you missed the announcement and description of this section, you can read it here again.
It features 10 broadly diversified and sector ETFs from my HighVolume list as posted every Saturday. Furthermore, they are screened for the lowest MaxDD% number meaning they have been showing better resistance to temporary sell offs than all others over the past year.
The below table simply demonstrates the magnitude with which some of the ETFs are fluctuating in regards to their positions above or below their respective individual trend lines (%M/A). A break below, represented by a negative number, shows weakness, while a break above, represented by a positive percentage, shows strength.
For hundreds of ETF choices, be sure to reference Thursday’s StatSheet.
Year to date, here’s how the 2017 candidates have fared so far:
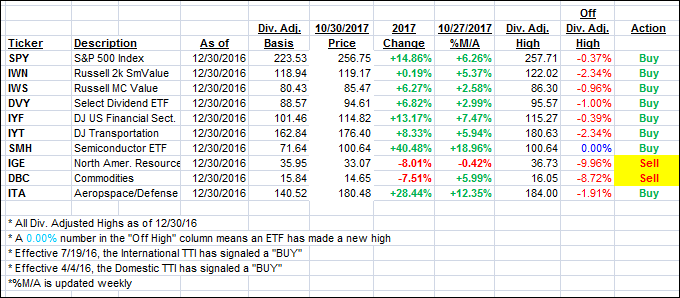
Again, the %M/A column above shows the position of the various ETFs in relation to their respective long term trend lines, while the trailing sell stops are being tracked in the “Off High” column. The “Action” column will signal a “Sell” once the -7.5% point has been taken out in the “Off High” column.
- Trend Tracking Indexes (TTIs)
Our Trend Tracking Indexes (TTIs) changed immaterially as the major indexes came off their highs.
Here’s how we closed 10/30/2017:
Domestic TTI: +3.12% (last close +3.23%)—Buy signal effective 4/4/2016
International TTI: +6.26% (last close +6.14%)—Buy signal effective 7/19/2016
Disclosure: I am obliged to inform you that I, as well as my advisory clients, own some of the ETFs listed in the above table. Furthermore, they do not represent a specific investment recommendation for you, they merely show which ETFs from the universe I track are falling within the guidelines specified.
Contact Ulli