
ETF Tracker StatSheet
https://theetfbully.com/2017/10/weekly-statsheet-etf-tracker-newsletter-updated-10192017/
ENDING THE WEEK WITH A BANG
- Moving the Markets
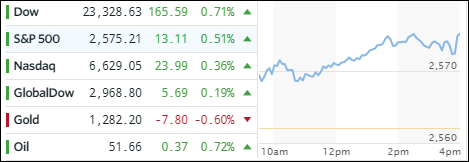
The major indexes opened up the session on the positive side of the unchanged line and never looked back, as the relentless ascent into record territory continued unabated. The big assist came from the Senate when it passed a “budget blueprint” for the next fiscal year, which is supposed to make way for Trump’s tax cuts, which in turn are vital to keep the bullish meme alive. At least, that’s the interpretation for the moment.
Nevertheless, the bulls feasted on the news, and we closed solidly in the green. GE performed magic today by falling 7% in pre-market trading based on abysmal earnings, horrible cash flow and slashing its profit forecast. A mid-day V-shaped recovery, for no reason, allowed the company to erase all losses and to close in the green. Amazing…
Equity ETFs had a good day, and we saw consistent gains across the board with only a couple of exceptions. Aerospace & Defense (ITA) took the lead with +1.27%; Transportations (IYT) came in second place with +0.90% while MidCaps (SCHM) placed third with +0.63%. The only red figures came from the International arena with the International SmallCaps (SCHC) sliding -0.22% and the International ETF (SCHF) giving back -0.09%.
Interest rates rose with the yield on the 10-year bond jumping 6 basis points to end the week at 2.39%, its highest level since early July. Crude oil rose and gold slipped. The US dollar (UUP) soared +0.58% after the budget vote, which was its best daily performance in 9 months.
- ETFs in the Spotlight (updated for 2017)
In case you missed the announcement and description of this section, you can read it here again.
It features 10 broadly diversified and sector ETFs from my HighVolume list as posted every Saturday. Furthermore, they are screened for the lowest MaxDD% number meaning they have been showing better resistance to temporary sell offs than all others over the past year.
The below table simply demonstrates the magnitude with which some of the ETFs are fluctuating in regards to their positions above or below their respective individual trend lines (%M/A). A break below, represented by a negative number, shows weakness, while a break above, represented by a positive percentage, shows strength.
For hundreds of ETF choices, be sure to reference Thursday’s StatSheet.
Year to date, here’s how the 2017 candidates have fared so far:

Again, the %M/A column above shows the position of the various ETFs in relation to their respective long term trend lines, while the trailing sell stops are being tracked in the “Off High” column. The “Action” column will signal a “Sell” once the -7.5% point has been taken out in the “Off High” column.
- Trend Tracking Indexes (TTIs)
Our Trend Tracking Indexes (TTIs) pulled back due to the re-calculation of the 39-week M/As.
Here’s how we closed 10/20/2017:
Domestic TTI: +2.86% (last close +3.11%)—Buy signal effective 4/4/2016
International TTI: +6.48% (last close +6.89%)—Buy signal effective 7/19/2016
Disclosure: I am obliged to inform you that I, as well as my advisory clients, own some of the ETFs listed in the above table. Furthermore, they do not represent a specific investment recommendation for you, they merely show which ETFs from the universe I track are falling within the guidelines specified.
————————————————————-
READER Q & A FOR THE WEEK
All Reader Q & A’s are listed at our web site!
Check it out at:
https://theetfbully.com/questions-answers/
———————————————————-
WOULD YOU LIKE TO HAVE YOUR INVESTMENTS PROFESSIONALLY MANAGED?
Do you have the time to follow our investment plans yourself? If you are a busy professional who would like to have his portfolio managed using our methodology, please contact me directly or get more details at:
https://theetfbully.com/personal-investment-management/
———————————————————
Back issues of the ETF/No Load Fund Tracker are available on the web at:
https://theetfbully.com/newsletter-archives/
Contact Ulli