
ETF Tracker StatSheet
https://theetfbully.com/2017/09/weekly-statsheet-etf-tracker-newsletter-updated-09212017/
EKING OUT SMALL GAINS
- Moving the Markets
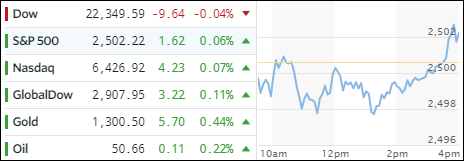
A late bounce helped the major indexes to gain enough upward momentum to eke out some small gains for the session with the exception of the Dow, which fell short and remained in the red. Despite this rebound, Apple (AAPL) continued its September downward trend having lost now -7.4%, as the company experienced its worst week ahead of an iPhone launch in over 7 years. Going the opposite direction were SmallCaps with the Russell 2000 ending at a record, which is its first record close since July 25th. While there is no guarantee, this move to new all-time highs can certainly be considered as a bullish indicator.
Despite the meandering of the major indexes, things ended on a much more solid footing in ETF space. Leading the pack to the upside were Semiconductors (SMH), SmallCaps (SCHA) and Transportations (IYT) with gains of +0.41%, +0.40% and +0.33% respectively. We saw the only red number in Emerging Markets (SCHE) with -0.58%.
In the interest rate arena, the yield on the 10-year Treasury bond pulled back 1 basis point to 2.26%, which helped the 20-year bond price gain +0.29%. Gold managed to conquer its $1,300 level again but only barely. The US Dollar completed its best 2-week rally since December but lost a tiny -0.08% for the day. However, the downward trend remains intact.
- ETFs in the Spotlight (updated for 2017)
In case you missed the announcement and description of this section, you can read it here again.
It features 10 broadly diversified and sector ETFs from my HighVolume list as posted every Saturday. Furthermore, they are screened for the lowest MaxDD% number meaning they have been showing better resistance to temporary sell offs than all others over the past year.
The below table simply demonstrates the magnitude with which some of the ETFs are fluctuating in regards to their positions above or below their respective individual trend lines (%M/A). A break below, represented by a negative number, shows weakness, while a break above, represented by a positive percentage, shows strength.
For hundreds of ETF choices, be sure to reference Thursday’s StatSheet.
Year to date, here’s how the 2017 candidates have fared so far:
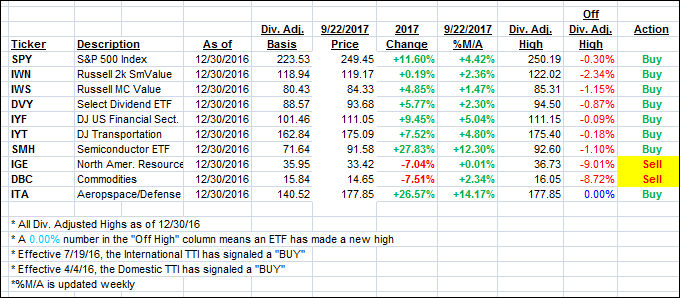
Again, the %M/A column above shows the position of the various ETFs in relation to their respective long term trend lines, while the trailing sell stops are being tracked in the “Off High” column. The “Action” column will signal a “Sell” once the -7.5% point has been taken out in the “Off High” column.
- Trend Tracking Indexes (TTIs)
Our Trend Tracking Indexes (TTIs) pulled back a tad due to the recalculation of the weekly Moving Average.
Here’s how we closed 9/22/2017:
Domestic TTI: +2.56% (last close +2.64%)—Buy signal effective 4/4/2016
International TTI: +6.91% (last close +7.24%)—Buy signal effective 7/19/2016
Disclosure: I am obliged to inform you that I, as well as my advisory clients, own some of the ETFs listed in the above table. Furthermore, they do not represent a specific investment recommendation for you, they merely show which ETFs from the universe I track are falling within the guidelines specified.
————————————————————-
READER Q & A FOR THE WEEK
All Reader Q & A’s are listed at our web site!
Check it out at:
https://theetfbully.com/questions-answers/
———————————————————-
WOULD YOU LIKE TO HAVE YOUR INVESTMENTS PROFESSIONALLY MANAGED?
Do you have the time to follow our investment plans yourself? If you are a busy professional who would like to have his portfolio managed using our methodology, please contact me directly or get more details at:
https://theetfbully.com/personal-investment-management/
———————————————————
Back issues of the ETF/No Load Fund Tracker are available on the web at:
https://theetfbully.com/newsletter-archives/
Contact Ulli