
ETF Tracker StatSheet
https://theetfbully.com/2017/08/weekly-statsheet-etf-tracker-newsletter-updated-08172017/
THE ROLLER COASTER RIDE CONTINUES
- Moving the Markets
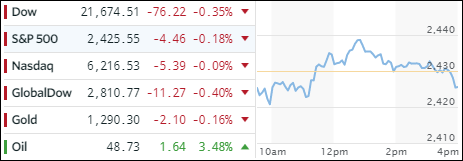
A mid-day rally, or was it a dead cat bounce, evaporated with the major indexes closing again below the unchanged line, although by only a slight margin. Volume was low, as it usually is during summer months which, when combined with nervous investors, leaves equities vulnerable. It was the second week of losses for the Dow and S&P, while the Nasdaq has now slipped four weeks in a row, its longest losing streak since May 2016. However, in the bigger scheme of things, this pullback is relatively minor compared to the post-election rally we’ve seen.
Interestingly, the frequently hyped Dow performance YTD has now slipped into second place, as gold’s recent rally pushed it ahead of the blue chip indicator. Gold managed to spike through the $1,300 resistance level today, for the third time this year, but failed to hold it into the close.
In regards to equity ETFs, there were few winners today. Emerging markets (SCHE) took top billing with a gain of +0.73%. Semiconductors (SMH) eked out +0.22% despite weakness in the Nasdaq, and the International SmallCaps (SCHC) ended up +0.35% higher.
Interest rates slipped during the week but closed unchanged today. The US dollar index (UUP) slid -0.33% but remains off the lows for the year enjoying its dead cat bounce while it lasts.
- ETFs in the Spotlight (updated for 2017)
In case you missed the announcement and description of this section, you can read it here again.
It features 10 broadly diversified and sector ETFs from my HighVolume list as posted every Saturday. Furthermore, they are screened for the lowest MaxDD% number meaning they have been showing better resistance to temporary sell offs than all others over the past year.
The below table simply demonstrates the magnitude with which some of the ETFs are fluctuating in regards to their positions above or below their respective individual trend lines (%M/A). A break below, represented by a negative number, shows weakness, while a break above, represented by a positive percentage, shows strength.
For hundreds of ETF choices, be sure to reference Thursday’s StatSheet.
Year to date, here’s how the 2017 candidates have fared so far:
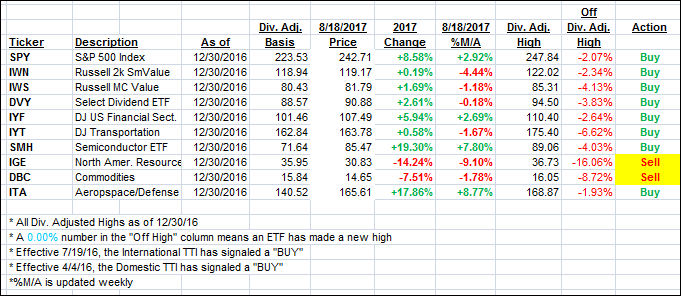
Again, the %M/A column above shows the position of the various ETFs in relation to their respective long term trend lines, while the trailing sell stops are being tracked in the “Off High” column. The “Action” column will signal a “Sell” once the -7.5% point has been taken out in the “Off High” column.
- Trend Tracking Indexes (TTIs)
Our Trend Tracking Indexes (TTIs) slipped again as upward momentum waned mid-day.
Here’s how we closed 8/18/2017:
Domestic TTI: +2.10% (last close +2.28%)—Buy signal effective 4/4/2016
International TTI: +5.63% (last close +5.87%)—Buy signal effective 7/19/2016
Disclosure: I am obliged to inform you that I, as well as my advisory clients, own some of the ETFs listed in the above table. Furthermore, they do not represent a specific investment recommendation for you, they merely show which ETFs from the universe I track are falling within the guidelines specified.
————————————————————-
READER Q & A FOR THE WEEK
All Reader Q & A’s are listed at our web site!
Check it out at:
https://theetfbully.com/questions-answers/
———————————————————-
WOULD YOU LIKE TO HAVE YOUR INVESTMENTS PROFESSIONALLY MANAGED?
Do you have the time to follow our investment plans yourself? If you are a busy professional who would like to have his portfolio managed using our methodology, please contact me directly or get more details at:
https://theetfbully.com/personal-investment-management/
———————————————————
Back issues of the ETF/No Load Fund Tracker are available on the web at:
https://theetfbully.com/newsletter-archives/
Contact Ulli