
- Moving the Markets
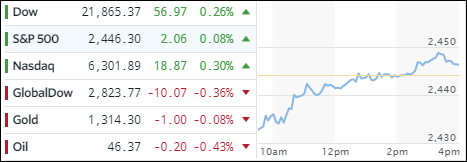
The early morning sell-off, which had the Dow down nearly 135 points, is now in the rearview mirror with the index staging its best intra-day comeback in 9 months. All the worries of the day, like continued provocations from N. Korea, debt ceiling talk and more fallout from hurricane Harvey, were either ignored or brushed aside to insure a “green” closing. After all, there are only 3 trading days left, and the S&P 500 still needs to gain +0.97% to make sure it does not experience its first losing month of 2017.
Across equity ETFs, the leader was, to no surprise as saber rattling was in full force, Aerospace & Defense (ITA) with a gain of +1.44%. Following closely were Transportations (IYT) with +0.91%, while Semiconductors (SMH) were lagging behind but still registering +0.28%. The minus side was led by International SmallCaps (SCHC) with -0.35% and International Equities (SCHF) losing -0.31% both a result of European markets getting clobbered.
Gold zigzagged and ended slightly lower but managed to successfully defend its $1,300 level. The yield on the 10-year bond dropped 3 basis points to 2.13% and is now hovering at a major support level. Any break below it and we could see much lower rates, which are quite a turnaround from the YTD highs of 2.52%, reached in early March. As a result of today’s lower yields, the 20-year bond (TLT) rallied +0.32%.
The US Dollar (UUP) had an interesting day. After getting hammered early on, it managed to recoup all of its losses and eked out a gain of +0.13%. Nevertheless, its long-term trend continues to be bearish, and I see more weakness ahead.
- ETFs in the Spotlight (updated for 2017)
In case you missed the announcement and description of this section, you can read it here again.
It features 10 broadly diversified and sector ETFs from my HighVolume list as posted every Saturday. Furthermore, they are screened for the lowest MaxDD% number meaning they have been showing better resistance to temporary sell offs than all others over the past year.
The below table simply demonstrates the magnitude with which some of the ETFs are fluctuating in regards to their positions above or below their respective individual trend lines (%M/A). A break below, represented by a negative number, shows weakness, while a break above, represented by a positive percentage, shows strength.
For hundreds of ETF choices, be sure to reference Thursday’s StatSheet.
Year to date, here’s how the 2017 candidates have fared so far:
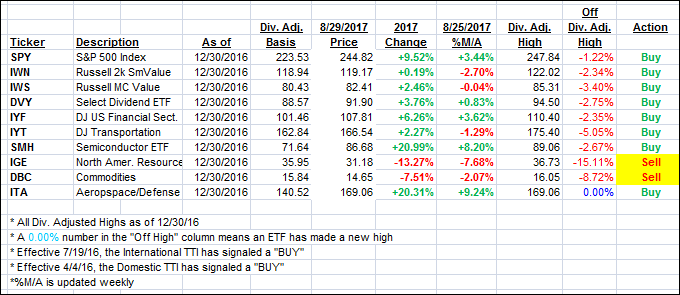
Again, the %M/A column above shows the position of the various ETFs in relation to their respective long term trend lines, while the trailing sell stops are being tracked in the “Off High” column. The “Action” column will signal a “Sell” once the -7.5% point has been taken out in the “Off High” column.
- Trend Tracking Indexes (TTIs)
Our Trend Tracking Indexes (TTIs) showed a mixed picture with the Domestic one gaining and the International losing as a result of Asian and European markets heading south sharply.
Here’s how we closed 8/29/2017:
Domestic TTI: +2.36% (last close +2.28%)—Buy signal effective 4/4/2016
International TTI: +5.58% (last close +5.97%)—Buy signal effective 7/19/2016
Disclosure: I am obliged to inform you that I, as well as my advisory clients, own some of the ETFs listed in the above table. Furthermore, they do not represent a specific investment recommendation for you, they merely show which ETFs from the universe I track are falling within the guidelines specified.
Contact Ulli