
- Moving the Markets
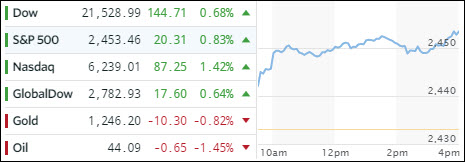
There was no hesitation nor looking back as the major indexes headed north right after the opening bell. The Dow and S&P scored new record highs while the Nasdaq rebounded solidly after last week’s weakness. The tech sector, as represented by XLK, added 1.5%, which was its biggest one-day gain since last December.
Of course, some see valuations as being way out of whack with the Fed’s tightening move, while at the same time, just about all data points are showing a weakening economic picture. Adding to the confusion was Fed’s Dudley uttering some hawkish tones that an “inverted yield curve” is not a problem. In case, you are not familiar with that term, ZH defines it this way:
An inverted yield curve, which has correctly predicted the last seven recessions going back to the late 1960’s, occurs when short-term interest rates yield more than longer-term rates. Why is an inverted yield curve so crucial in determining the direction of markets and the economy? Because when bank assets (longer-duration loans) generate less income than bank liabilities (short-term deposits), the incentive to make new loans dries up along with the money supply. And when asset bubbles are starved of that monetary fuel they burst. The severity of the recession depends on the intensity of the asset bubbles in existence prior to the inversion.
As a result interest rates rose (bonds down) with the 10-year T-Bond yield increasing 3 basis points to 2.19% and hovering just below its 200-day M/A of 2.21%. The dollar rallied with UUP gaining +0.44% while gold lost and settled at $1,246.20. Oil followed suit and is now stuck below the $45/barrel level, which is a 14.6% drop from its late May high of $52.00.
- ETFs in the Spotlight (updated for 2017)
In case you missed the announcement and description of this section, you can read it here again.
It features 10 broadly diversified and sector ETFs from my HighVolume list as posted every Saturday. Furthermore, they are screened for the lowest MaxDD% number meaning they have been showing better resistance to temporary sell offs than all others over the past year.
The below table simply demonstrates the magnitude with which some of the ETFs are fluctuating in regards to their positions above or below their respective individual trend lines (%M/A). A break below, represented by a negative number, shows weakness, while a break above, represented by a positive percentage, shows strength.
For hundreds of ETF choices, be sure to reference Thursday’s StatSheet.
Year to date, here’s how the 2017 candidates have fared so far:
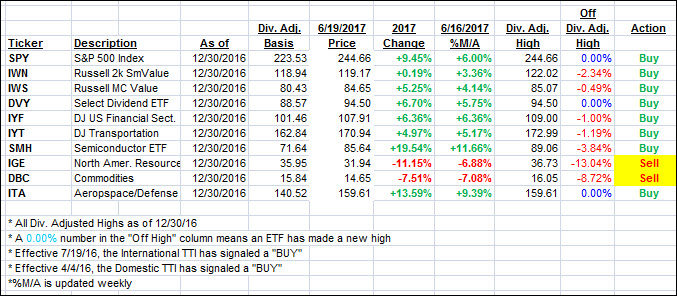
Again, the %M/A column above shows the position of the various ETFs in relation to their respective long term trend lines, while the trailing sell stops are being tracked in the “Off High” column. The “Action” column will signal a “Sell” once the -7.5% point has been taken out in the “Off High” column.
- Trend Tracking Indexes (TTIs)
Our Trend Tracking Indexes (TTIs) rallied with the major indexes and closed up.
Here’s how we closed 6/19/2017:
Domestic TTI: +3.79% (last close +3.41%)—Buy signal effective 4/4/2016
International TTI: +7.87% (last close +7.17%)—Buy signal effective 7/19/2016
Disclosure: I am obliged to inform you that I, as well as my advisory clients, own some of the ETFs listed in the above table. Furthermore, they do not represent a specific investment recommendation for you, they merely show which ETFs from the universe I track are falling within the guidelines specified.
Contact Ulli