
ETF Tracker StatSheet
https://theetfbully.com/2017/05/weekly-statsheet-etf-tracker-newsletter-updated-05252017/
PUSHING HIGHER
- Moving the Markets
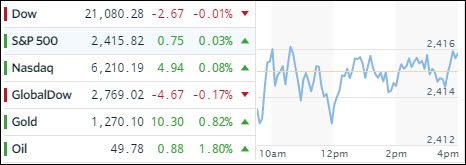
Despite treading water all day, the S&P 500 and Nasdaq managed to crawl slightly above the unchanged line, thanks to a last minute levitation, thereby closing at another all-time high. Today’s assist came from a rise in consumer discretionary stocks like Best Buy (BBY), which pulled back a little today after adding +21.5% on Thursday. Even oil showed some signs of life after yesterday’s drubbing by gaining +1.80%.
Today’s gains, although tiny, had nothing to do with improving fundamentals, which still leave a lot to be desired of, to say it mildly. Case in point is the US Macro data index, which now has fallen to 15-month lows, as well as the Nasdaq Composite, the Earnings Expectations of which have slumped to 2017 lows; but, none of these data points matter, until one day when they do.
CitiBank came out forecasting that a close today above 2,405 on the S&P 500 suggests we can rally towards 2,500+ in the coming weeks. While that is a positive prediction, I prefer not to guess but to use my Domestic Trend Tracking Index (TTI) for directional guidance. The TTI is currently deeply entrenched on the bullish side (see section 3), and we will follow its trend until it either ends or our trailing sell stop points give the signal to exit.
- ETFs in the Spotlight (updated for 2017)
In case you missed the announcement and description of this section, you can read it here again.
It features 10 broadly diversified and sector ETFs from my HighVolume list as posted every Saturday. Furthermore, they are screened for the lowest MaxDD% number meaning they have been showing better resistance to temporary sell offs than all others over the past year.
The below table simply demonstrates the magnitude with which some of the ETFs are fluctuating in regards to their positions above or below their respective individual trend lines (%M/A). A break below, represented by a negative number, shows weakness, while a break above, represented by a positive percentage, shows strength.
For hundreds of ETF choices, be sure to reference Thursday’s StatSheet.
Year to date, here’s how the 2017 candidates have fared so far:
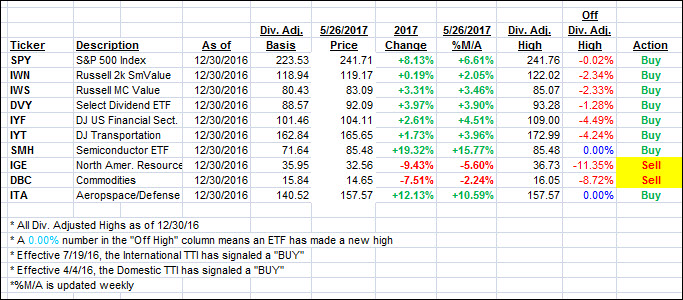
Again, the %M/A column above shows the position of the various ETFs in relation to their respective long term trend lines, while the trailing sell stops are being tracked in the “Off High” column. The “Action” column will signal a “Sell” once the -7.5% point has been taken out in the “Off High” column.
- Trend Tracking Indexes (TTIs)
Our Trend Tracking Indexes (TTIs) barely moved as the major indexes moved predominantly sideways ahead of the 3-day weekend.
Here’s how we closed 5/26/2017:
Domestic TTI: +3.68% (last close +3.78%)—Buy signal effective 4/4/2016
International TTI: +8.34% (last close +8.87%)—Buy signal effective 7/19/2016
Disclosure: I am obliged to inform you that I, as well as my advisory clients, own some of the ETFs listed in the above table. Furthermore, they do not represent a specific investment recommendation for you, they merely show which ETFs from the universe I track are falling within the guidelines specified.
————————————————————-
READER Q & A FOR THE WEEK
All Reader Q & A’s are listed at our web site!
Check it out at:
https://theetfbully.com/questions-answers/
———————————————————-
WOULD YOU LIKE TO HAVE YOUR INVESTMENTS PROFESSIONALLY MANAGED?
Do you have the time to follow our investment plans yourself? If you are a busy professional who would like to have his portfolio managed using our methodology, please contact me directly or get more details at:
https://theetfbully.com/personal-investment-management/
———————————————————
Back issues of the ETF/No Load Fund Tracker are available on the web at:
https://theetfbully.com/newsletter-archives/
Contact Ulli