
- Moving the Markets
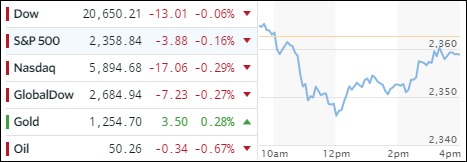
Two things pulled the rug out from early positive momentum at the opening. One, disappointing March auto sales, which should not have come as a surprise given the gigantic slip in retail sales including some 3,500 announced store closings, and two, the topic I have been pounding on lately, namely that questions about Trump’s pro-business stimulus plans continue to make headlines as to whether they really can be implemented in a timely manner. But, hope still prevails…
As we’ve seen many times before, the downside slip was contained, and the indexes spent the rest of the session grinding back towards the unchanged line but did not manage to cross it to the upside. Weakness in the markets was broad with the exception of Emerging Markets, which managed to gain +0.88%, while gold also closed up.
The dollar was modestly higher, but interest rates continued their recent downward slide with the 20-year T-bond (TLT) gaining +1.01%.
Adding to the general nervousness was news about a probable terrorist attack in Russia, which killed 10 people.
- ETFs in the Spotlight (updated for 2017)
In case you missed the announcement and description of this section, you can read it here again.
It features 10 broadly diversified and sector ETFs from my HighVolume list as posted every Saturday. Furthermore, they are screened for the lowest MaxDD% number meaning they have been showing better resistance to temporary sell offs than all others over the past year.
The below table simply demonstrates the magnitude with which some of the ETFs are fluctuating in regards to their positions above or below their respective individual trend lines (%M/A). A break below, represented by a negative number, shows weakness, while a break above, represented by a positive percentage, shows strength.
For hundreds of ETF choices, be sure to reference Thursday’s StatSheet.
Year to date, here’s how the 2017 candidates have fared so far:
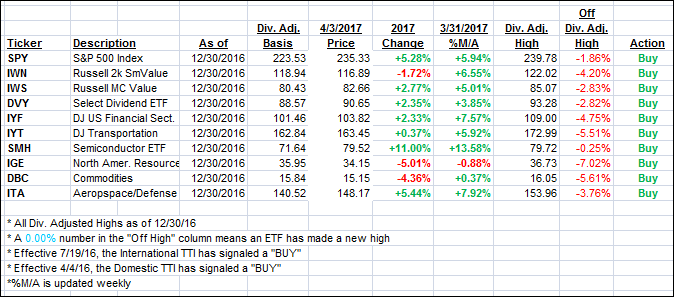
Again, the %M/A column above shows the position of the various ETFs in relation to their respective long term trend lines, while the trailing sell stops are being tracked in the “Off High” column. The “Action” column will signal a “Sell” once the -7.5% point has been taken out in the “Off High” column.
- Trend Tracking Indexes (TTIs)
Our Trend Tracking Indexes (TTIs) pulled back as the indexes spent the day recovering from an early sell-off.
Here’s how we closed 4/3/2017:
Domestic TTI: +2.42% (last close +2.51%)—Buy signal effective 4/4/2016
International TTI: +5.16% (last close +5.46%)—Buy signal effective 7/19/2016
Disclosure: I am obliged to inform you that I, as well as my advisory clients, own some of the ETFs listed in the above table. Furthermore, they do not represent a specific investment recommendation for you, they merely show which ETFs from the universe I track are falling within the guidelines specified.
Contact Ulli