
- Moving the Markets
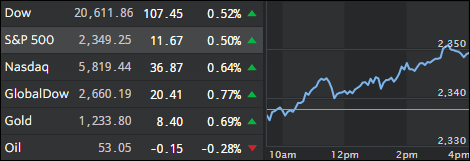
The bulls continued to have their way on Wall Street with today’s support coming from positive data confirming that the US economy is heating up and leaving the Fed behind in terms of controlling inflation via higher rates. The CPI number can only be described as “blistering” at a strong 2.3% print vs expectations of a 2.1% reading, which is well above the Fed’s target of 2.0%.
This was followed by strong retail sales, after a bleak Holiday season, as consumers appeared to be optimistic over Trump’s plans. Retails sales jumped 0.4% in the month of January, much better than the 0.1% expected. The only fly in the ointment is the recent weakness in wages (-0.6% YoY) which, in light of rising inflation, casts a shadow on how long this spending spree can last.
So what is really behind the current “melt-up” rally? Fed chief Yellen provided the answer today during her testimony in front of the House Financial Services committee: “I think market participants likely are anticipating shifts in fiscal policy that will stimulate growth and perhaps raise earnings.” Yes, and that is commonly referred to as the Trump rally. My only question is: How long can this last without a serious correction?
- ETFs in the Spotlight (updated for 2017)
In case you missed the announcement and description of this section, you can read it here again.
It features 10 broadly diversified and sector ETFs from my HighVolume list as posted every Saturday. Furthermore, they are screened for the lowest MaxDD% number meaning they have been showing better resistance to temporary sell offs than all others over the past year.
The below table simply demonstrates the magnitude with which some of the ETFs are fluctuating in regards to their positions above or below their respective individual trend lines (%M/A). A break below, represented by a negative number, shows weakness, while a break above, represented by a positive percentage, shows strength.
For hundreds of ETF choices, be sure to reference Thursday’s StatSheet.
Year to date, here’s how the 2017 candidates have fared so far:
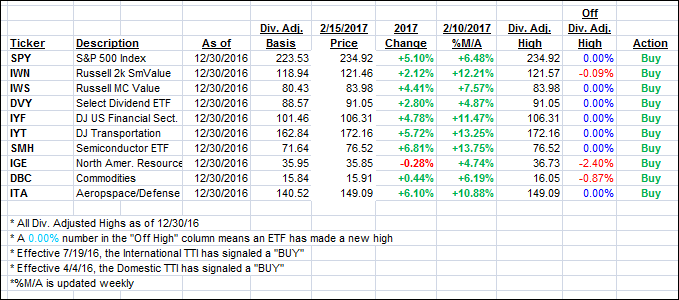
Again, the %M/A column above shows the position of the various ETFs in relation to their respective long term trend lines, while the trailing sell stops are being tracked in the “Off High” column. The “Action” column will signal a “Sell” once the -7.5% point has been taken out in the “Off High” column.
- Trend Tracking Indexes (TTIs)
Our Trend Tracking Indexes (TTIs) continued their march deeper into bullish territory as the major indexes only know how to move one way—and that is up—for the time being.
Here’s how we closed 2/15/2017:
Domestic TTI: +2.79% (last close +2.61%)—Buy signal effective 4/4/2016
International TTI: +5.74% (last close +5.16%)—Buy signal effective 7/19/2016
Disclosure: I am obliged to inform you that I, as well as my advisory clients, own some of the ETFs listed in the above table. Furthermore, they do not represent a specific investment recommendation for you, they merely show which ETFs from the universe I track are falling within the guidelines specified.
Contact Ulli