
- Moving the Markets
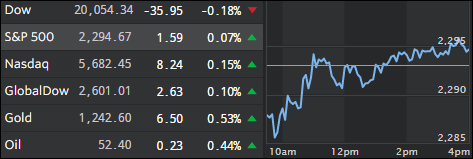
Mixed earnings and slipping bank stocks put a damper on the major indexes, which started the session below the unchanged line. This would normally be the time in the quarter where earnings are front and center, but not this time; the rally has stagnated recently, as Wall Street prefers to look for more details about Trump’s economic agenda.
Still, we continue to hover around record highs with any pullbacks being limited via Fed intervention. For today, banks slipped as bond yields got hammered, losing 6 basis points, or 2.5% causing TLT to rally at the tune of +1.36%.
The dollar dropped but gold was the savior and rallied +0.53%, which is its 8th day of gains out of nine. Here’s another dubious record: The S&P 500 has now traded for 37 days in a row without a 1% intra-day move and 81 days in a row without a 1% drop. If that is not market manipulation, I don’t know what is.
- ETFs in the Spotlight (updated for 2017)
In case you missed the announcement and description of this section, you can read it here again.
It features 10 broadly diversified and sector ETFs from my HighVolume list as posted every Saturday. Furthermore, they are screened for the lowest MaxDD% number meaning they have been showing better resistance to temporary sell offs than all others over the past year.
The below table simply demonstrates the magnitude with which some of the ETFs are fluctuating in regards to their positions above or below their respective individual trend lines (%M/A). A break below, represented by a negative number, shows weakness, while a break above, represented by a positive percentage, shows strength.
For hundreds of ETF choices, be sure to reference Thursday’s StatSheet.
Year to date, here’s how the 2017 candidates have fared so far:
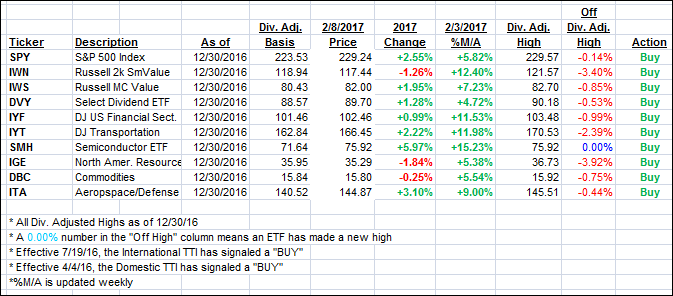
Again, the %M/A column above shows the position of the various ETFs in relation to their respective long term trend lines, while the trailing sell stops are being tracked in the “Off High” column. The “Action” column will signal a “Sell” once the -7.5% point has been taken out in the “Off High” column.
- Trend Tracking Indexes (TTIs)
Our Trend Tracking Indexes (TTIs) barely changed as stocks continued with their sideways pattern.
Here’s how we closed 2/8/2017:
Domestic TTI: +2.13% (last close +2.08%)—Buy signal effective 4/4/2016
International TTI: +4.42% (last close +4.41%)—Buy signal effective 7/19/2016
Disclosure: I am obliged to inform you that I, as well as my advisory clients, own some of the ETFs listed in the above table. Furthermore, they do not represent a specific investment recommendation for you, they merely show which ETFs from the universe I track are falling within the guidelines specified.
Contact Ulli