
- Moving the Markets
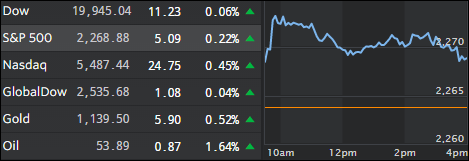
The major indexes managed to crawl higher today but hopes of the Dow taking out the 20,000 marker were dashed again with the index barely remaining above the unchanged line. For December 27th, today was the lowest volume day in over 10 years, which will most likely continue for the remainder of this week.
Consumer confidence went parabolic and shot up to its highest in more than 15 years, which is hard to believe considering the weak underlying fundamentals. But, then again it’s all based on hope that business conditions will strengthen in the future based on Trump’s infrastructure spending plan along with lower taxes and deregulation. Makes me wonder what might happen should the bloom fall off this flower unexpectedly…
In corporate news, Amazon reported that it shipped an amazing 1 billion items worldwide this holiday season calling it the best year they ever had.
- ETFs in the Spotlight
In case you missed the announcement and description of this section, you can read it here again.
It features 10 broadly diversified ETFs from my HighVolume list as posted every Monday. Furthermore, they are screened for the lowest MaxDD% number meaning they have been showing better resistance to temporary sell offs than all others over the past year.
Here are the 10 candidates:
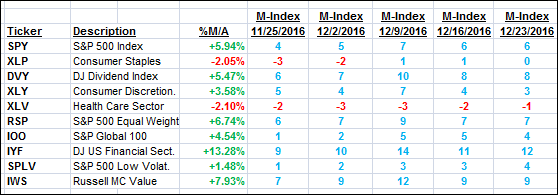
The above table simply demonstrates the magnitude with which some of the ETFs are fluctuating in regards to their positions above or below their respective individual trend lines (%M/A). A break below, represented by a negative number, shows weakness, while a break above, represented by a positive percentage, shows strength.
For hundreds of ETF choices, be sure to reference Thursday’s StatSheet.
Year to date, here’s how the above candidates have fared so far:
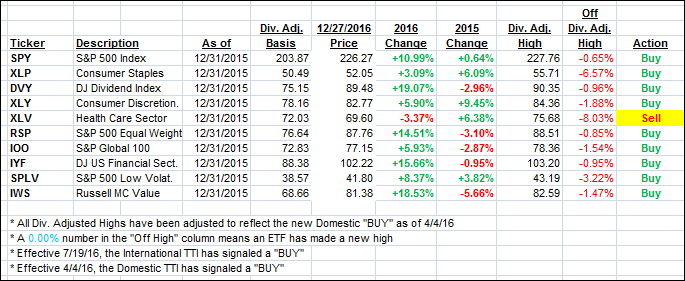
Again, the first table above shows the position of the various ETFs in relation to their respective long term trend lines (%M/A), while the second one tracks their trailing sell stops in the “Off High” column. The “Action” column will signal a “Sell” once the -7.5% point has been taken out in the “Off High” column.
- Trend Tracking Indexes (TTIs)
Our Trend Tracking Indexes (TTIs) edged up with the major indexes.
Here’s how we closed 12/27/2016:
Domestic TTI: +1.32% (last close +1.24%)—Buy signal effective 4/4/2016
International TTI: +2.22% (last close +2.20%)—Buy signal effective 7/19/2016
Merry Christmas!
Ulli…
Disclosure: I am obliged to inform you that I, as well as my advisory clients, own some of the ETFs listed in the above table. Furthermore, they do not represent a specific investment recommendation for you, they merely show which ETFs from the universe I track are falling within the guidelines specified.
Contact Ulli