
1. Moving the Markets
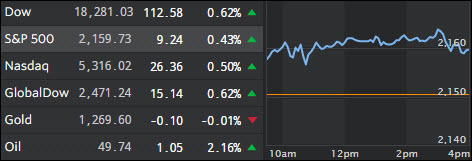
Economic data were mixed with ADP reporting that the US economy added 154k jobs in September vs expectations of 165k. The US trade deficit unexpectedly grew in August as imports increased more than exports putting downward pressure on Q3 GDP while factory orders declined for the 22nd straight month. The only bright spot was that the ISM services index exploded to its highest level since October 2015, which makes me wonder if such an outlier will be revised sharply next month.
Just because I haven’t mentioned Deutsche Bank (DB) in a couple days, does not mean all of their issues have been resolved. Far from it! I am sure there are a lot of behind-the-scenes discussions going on as to how to save this behemoth of a bank.
Reuters reports that the German government is persuing “discreet” talks with US officials to possibly help DB secure a swift settlement:
One senior government official told Reuters there was “contact at all levels” between German and American officials. Another source said Finance Minister Wolfgang Schaeuble was not planning to meet DOJ officials during a trip to Washington this week for International Monetary Fund meetings, but added: “You can hold talks. It doesn’t have to be the minister.”
I believe the heat is on and despite jawboning to the opposite by one German party member that “At the present time, I rule out capital assistance.” While that maybe his current view, ZH concluded accurately:
There is just one small problem: Deutsche Bank holds over half a trillion euros in deposits on its balance sheet, which means that if push comes to shove, Germans will be begging for a bailout just to have access to their savings.
2. ETFs in the Spotlight
In case you missed the announcement and description of this section, you can read it here again.
It features 10 broadly diversified ETFs from my HighVolume list as posted every Monday. Furthermore, they are screened for the lowest MaxDD% number meaning they have been showing better resistance to temporary sell offs than all others over the past year.
Here are the 10 candidates:
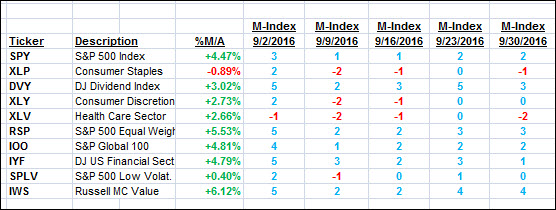
The above table simply demonstrates the magnitude with which some of the ETFs are fluctuating in regards to their positions above or below their respective individual trend lines (%M/A). A break below, represented by a negative number, shows weakness, while a break above, represented by a positive percentage, shows strength.
For hundreds of ETF choices, be sure to reference Thursday’s StatSheet.
Year to date, here’s how the above candidates have fared so far:
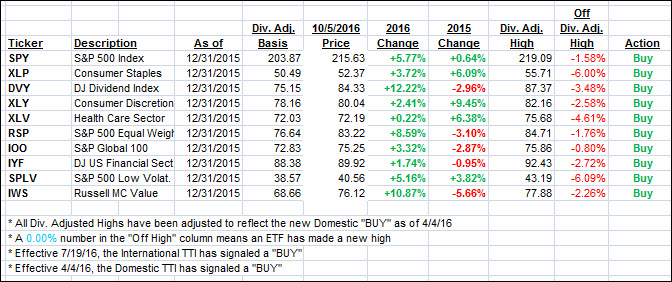
Again, the first table above shows the position of the various ETFs in relation to their respective long term trend lines (%M/A), while the second one tracks their trailing sell stops in the “Off High” column. The “Action” column will signal a “Sell” once the -7.5% point has been taken out in the “Off High” column.
3. Trend Tracking Indexes (TTIs)
Our Trend Tracking Indexes (TTIs) recovered and closed higher.
Here’s how we closed 10/5/2016:
Domestic TTI: +2.14% (last close +2.03%)—Buy signal effective 4/4/2016
International TTI: +4.88% (last close +4.68%)—Buy signal effective 7/19/2016
Disclosure: I am obliged to inform you that I, as well as my advisory clients, own some of the ETFs listed in the above table. Furthermore, they do not represent a specific investment recommendation for you, they merely show which ETFs from the universe I track are falling within the guidelines specified.
Contact Ulli