
1. Moving the Markets
As I mentioned Friday, Deutsche Bank’s (DB) rumor of an impending and sharply reduced settlement blew up in smoke over the weekend as it turned out that not only was a settlement not reached but there had not even been a meeting with the DOJ to discuss matters. But the good news is DB’s executives are scheduled to head to the US very soon.
Adding insult to injury were reports that some DB customers could not access their ATMs or debit cards. That’s why I think the rumor was just a diversion to keep the troops calm and orderly. DB has over $320 billion in retail deposits and any question in the public’s eye as to potential liquidity problems would result in a bank run.
But that was not all as Italy added even more insult to injury by filing a lawsuit against several DB executives alleging improper/criminal behavior in regards to derivatives. Good thing Germany had a bank holiday today, so we’ll have to wait for tomorrow to see if there is more fallout. At this moment, it sure smells like a 2008 Lehman Brothers repeat in the making.
In case you are wondering how closely DB is tied to the rest of the world, take a look at this chart, which makes it abundantly clear that whatever happens to DB will spread around the globe.
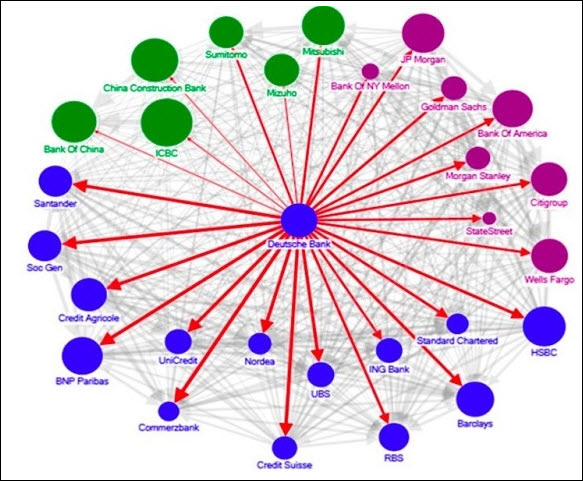
Source: armstrongeconomics.com
A picture is worth a thousand words.
2. ETFs in the Spotlight
In case you missed the announcement and description of this section, you can read it here again.
It features 10 broadly diversified ETFs from my HighVolume list as posted every Monday. Furthermore, they are screened for the lowest MaxDD% number meaning they have been showing better resistance to temporary sell offs than all others over the past year.
Here are the 10 candidates:
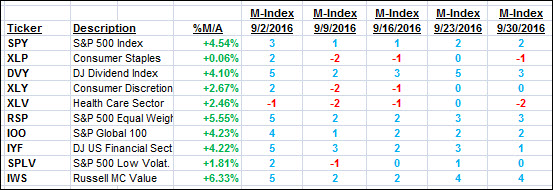
The above table simply demonstrates the magnitude with which some of the ETFs are fluctuating in regards to their positions above or below their respective individual trend lines (%M/A). A break below, represented by a negative number, shows weakness, while a break above, represented by a positive percentage, shows strength.
For hundreds of ETF choices, be sure to reference Thursday’s StatSheet.
Year to date, here’s how the above candidates have fared so far:
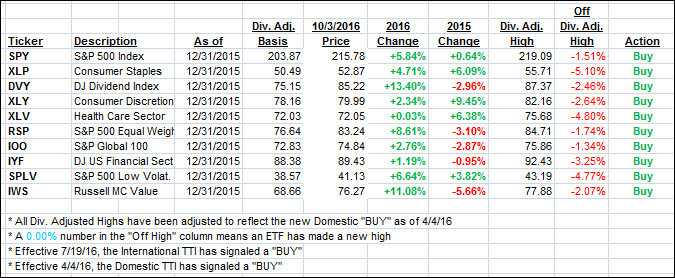
Again, the first table above shows the position of the various ETFs in relation to their respective long term trend lines (%M/A), while the second one tracks their trailing sell stops in the “Off High” column. The “Action” column will signal a “Sell” once the -7.5% point has been taken out in the “Off High” column.
3. Trend Tracking Indexes (TTIs)
Both of our Trend Tracking Indexes (TTIs) hardly changed as the major indexes pulled back.
Here’s how we closed 10/3/2016:
Domestic TTI: +2.24% (last close +2.38%)—Buy signal effective 4/4/2016
International TTI: +4.68% (last close +4.60%)—Buy signal effective 7/19/2016
Disclosure: I am obliged to inform you that I, as well as my advisory clients, own some of the ETFs listed in the above table. Furthermore, they do not represent a specific investment recommendation for you, they merely show which ETFs from the universe I track are falling within the guidelines specified.
Contact Ulli