
1. Moving the Markets
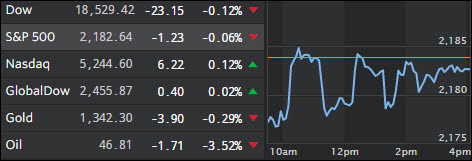
Q2 earnings season has all but wrapped up, now that retailer Walmart (WMT) has reported its results. The theme remains that investors are somewhat pleased the dip in profit growth by companies in the S&P 500 was less than expected. Companies within the index reported 2.1% lower adjusted profit per share, which was somewhat better than the 5% expected profit drop. A side note of something to consider, however, is that it’s the fourth consecutive drop in quarterly earnings growth for the S&P.
In Fed news, Janet Yellen will speak on Friday about the central bank’s long-term policy framework. Before then, reports on home sales, orders of long-lasting goods and the U.S. trade balance will hold the spotlight in this week’s economic news.
In energy news today, we heard a report that Asia’s biggest economy (China) is well on its way to becoming the world’s second-largest producer of natural gas. China’s oil and gas majors are suffering not just from low oil prices but also from mature fields, many of them nearing depletion. However, its energy needs are not declining, and the country is still the world’s top energy consumer, with consumption 30% higher than that of the U.S.
2. ETFs in the Spotlight
In case you missed the announcement and description of this section, you can read it here again.
It features 10 broadly diversified ETFs from my HighVolume list as posted every Monday. Furthermore, they are screened for the lowest MaxDD% number meaning they have been showing better resistance to temporary sell offs than all others over the past year.
Here are the 10 candidates:
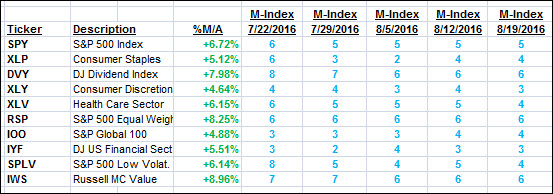
The above table simply demonstrates the magnitude with which some of the ETFs are fluctuating in regards to their positions above or below their respective individual trend lines (%M/A). A break below, represented by a negative number, shows weakness, while a break above, represented by a positive percentage, shows strength.
For hundreds of ETF choices, be sure to reference Thursday’s StatSheet.
Year to date, here’s how the above candidates have fared so far:
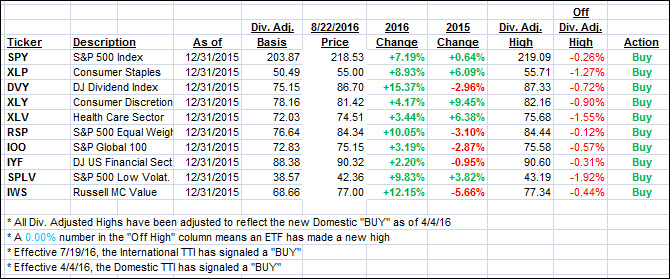
Again, the first table above shows the position of the various ETFs in relation to their respective long term trend lines (%M/A), while the second one tracks their trailing sell stops in the “Off High” column. The “Action” column will signal a “Sell” once the -7.5% point has been taken out in the “Off High” column.
3. Trend Tracking Indexes (TTIs)
Our Trend Tracking Indexes (TTIs) went nowhere as today’s markets action resembled on big roller-coaster with the major indexes desperately trying to reclaim the unchanged line.
Here’s how we closed 8/22/2016:
Domestic TTI: +3.07% (last close +3.02%)—Buy signal effective 4/4/2016
International TTI: +4.69% (last close +4.72%)—Buy signal effective 7/19/2016
Disclosure: I am obliged to inform you that I, as well as my advisory clients, own some of the ETFs listed in the above table. Furthermore, they do not represent a specific investment recommendation for you, they merely show which ETFs from the universe I track are falling within the guidelines specified.
Contact Ulli