1. Moving the Markets
U.S. stocks extended their record-setting rally and closed at new all-time highs today as investors felt relief by an earnings report from Bank of America (BAC) and a failed coup attempt in Turkey over the weekend. Computer algos, as usual, engaged in a game of headline hockey as Yahoo reported BofAs “better-than-expected profit,” while the far more analytical and realistic ZeroHedge featured “Bank of America’s Profit tumbles 19%,” detailing that the EPS “Beat” was based on a surge in cost-cutting. Well, you can always put some lipstick on that pig to make sure the indexes are rallying.
In a sign of the market’s new resiliency and breakout from its 14-month trading range, it kicked off the week in the black. Last week’s terror attack in the south of France and the latest deadly killing of three U.S. police officers in Baton Rouge did not help investor sentiment, however, markets have stayed strong nonetheless.
In the world of internet media, with a possible new buyer waiting in the wings, Yahoo (YHOO) delivered what most were expecting in its second quarter earnings report: lower expenses and slower growth. The company’s investors are still awaiting a potential corporate sale by the end of 2016, but the stock continues to perform well nonetheless.
Earnings season has arrived. More than 90 companies in the S&P 500 are set to report earnings this week and currently, analysts are expecting earnings in the April-thru-June period to contract 4.5%. If this contraction takes place, it would mark the fourth quarter in a row with negative profit growth. The hope on Wall Street is that the so-called “earnings recession” will end in the second quarter, paving the way for a resumption of profit growth beginning in the current quarter, which began July 1 and ends Sept. 30. Sure, more lipstick on that pig…
2. ETFs in the Spotlight
In case you missed the announcement and description of this section, you can read it here again.
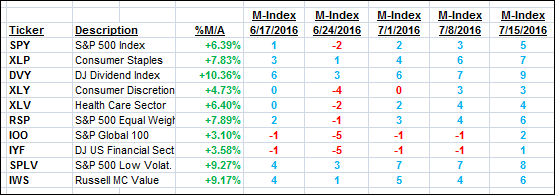
It features 10 broadly diversified ETFs from my HighVolume list as posted every Monday. Furthermore, they are screened for the lowest MaxDD% number meaning they have been showing better resistance to temporary sell offs than all others over the past year.
Here are the 10 candidates:

The above table simply demonstrates the magnitude with which some of the ETFs are fluctuating in regards to their positions above or below their respective individual trend lines (%M/A). A break below, represented by a negative number, shows weakness, while a break above, represented by a positive percentage, shows strength.
For hundreds of ETF/Mutual fund choices, be sure to reference Thursday’s StatSheet.
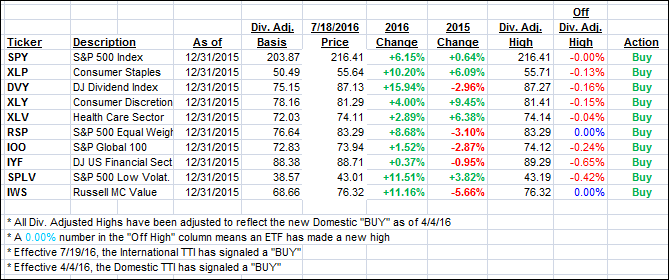
Year to date, here’s how the above candidates have fared so far:

Again, the first table above shows the position of the various ETFs in relation to their respective long term trend lines (%M/A), while the second one tracks their trailing sell stops in the “Off High” column. The “Action” column will signal a “Sell” once the -7.5% point has been taken out in the “Off High” column.
3. Trend Tracking Indexes (TTIs)
Our Domestic Trend Tracking Index (TTI) crawled higher while the International one jumped signaling a new BUY for “broadly diversified international equity ETFs/mutual funds.” For tracking purposes, the effective date will be tomorrow, July 19, 2016.
Again, as is my habit, should the markets open up tomorrow severely to the downside, I will hold off with this new BUY signal for another day.
Here’s how we closed 7/18/2016:
Domestic TTI: +2.71% (last close +2.60%)—Buy signal effective 4/4/2016
International TTI: +2.10% (last close +1.80%)—Buy signal effective 7/19/2016
Disclosure: I am obliged to inform you that I, as well as advisory clients of mine, own some of these listed ETFs. Furthermore, they do not represent a specific investment recommendation for you, they merely show which ETFs from the universe I track are falling within the guidelines specified.
Contact Ulli