
1. Moving the Markets
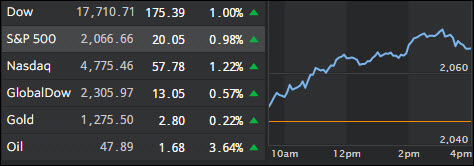
Coming off a three week losing streak, the stock market kicked off the new week in rally mode as investors eyed more retail earnings, digest news related to corporate deals and await Wednesday’s release of minutes of the Fed’s April meeting.
All three major indexes gained at least 1% on the day. The Dow’s rise was helped by a nearly 4% jump in shares of Apple (AAPL), after Berkshire Hathaway reported a $900 million stake in the iPhone maker in an SEC filing.
There was a notable amount of news in the M&A world today as well. Drugmaker Pfizer (PFE) announced it is buying Anacor Pharmaceuticals (ANAC) for $5.2 million. Gannett (GCI), parent company of USA TODAY, said it upped its bid for Tribune Publishing (TPUB) to $15 per share from an initial offer of $12.25. And Yahoo (YHOO) shares gained 2.7% amid reports that billionaire Warren Buffett and Berkshire Hathaway (BRK-A) might provide financing to Quicken Loans founder Dan Gilbert, who is said to be interested in buying the Internet company.
Wall Street is bracing for a busy week. The earnings parade will pick up Tuesday with results from Home Depot (HD), Lowe’s (LOW), Target (TGT), Walmart (WMT), Gap (GPS) and FootLocker (FL) reporting later in the week.
2. ETFs in the Spotlight
In case you missed the announcement and description of this section, you can read it here again.
It features 10 broadly diversified ETFs from my HighVolume list as posted every Monday. Furthermore, they are screened for the lowest MaxDD% number meaning they have been showing better resistance to temporary sell offs than all others over the past year.
Here are the 10 candidates:
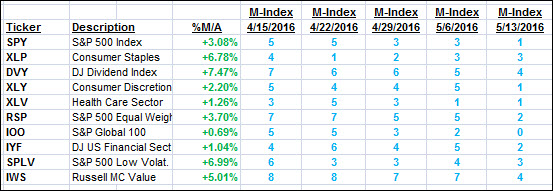
The above table simply demonstrates the magnitude with which some of the ETFs are fluctuating in regards to their positions above or below their respective individual trend lines (%M/A). A break below, represented by a negative number, shows weakness, while a break above, represented by a positive percentage, shows strength.
For hundreds of ETF/Mutual fund choices, be sure to reference Thursday’s StatSheet.
Year to date, here’s how the above candidates have fared so far:
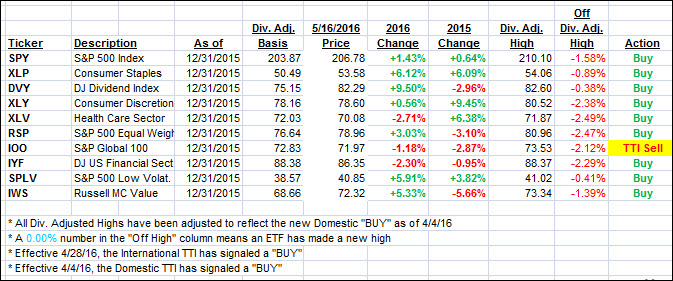
Again, the first table above shows the position of the various ETFs in relation to their respective long term trend lines (%M/A), while the second one tracks their trailing sell stops in the “Off High” column. The “Action” column will signal a “Sell” once the -7.5% point has been taken out in the “Off High” column.
3. Trend Tracking Indexes (TTIs)
Our Domestic Trend Tracking Index (TTI) headed north further into bullish territory. The International one improved as well—but not enough to invalidate Friday’s Sell signal.
Here’s how we ended up:
Domestic TTI: +1.37% (last close +1.03%)—Buy signal effective 4/4/2016
International TTI: -0.87% (last close -1.72%)—Sell signal effective 5/16/2016
Disclosure: I am obliged to inform you that I, as well as advisory clients of mine, own some of these listed ETFs. Furthermore, they do not represent a specific investment recommendation for you, they merely show which ETFs from the universe I track are falling within the guidelines specified.
Contact Ulli