
1. Moving the Markets
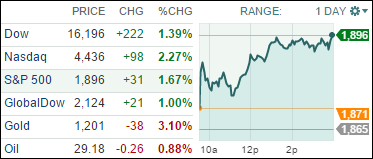
Stocks fared well and extended Friday’s short covering rally as traders returned from the long weekend and Wall Street reacted to news that Saudi Arabia, Russia, Qatar and Venezuela have agreed to cap crude production at January levels if other major producers, such as Iraq and Iran, follow suit. Of course, we have heard this story before as jawboning OPECers have yet to follow through on any recent agreement; so color me skeptical.
Sinking oil prices have been a major cause of financial market turbulence to start 2016, as it has caused sharp drops in both the share price and earnings of oil-related stocks that resulted in negative ripple effects around the globe, including rising fears of recession. The tentative move to support prices, as it requires buy-in from other oil-producing nations in the Middle East, is hoped to be a first-step towards stabilizing crude prices.
There was an interesting bit of news about Apple (AAPL) today. Apparently, the company plans to sell a series of bonds maturing as soon as 2018 and as far out as 2046. The move might seem curious since Apple has $216 billion in cash and investments in the bank. Analysts say it’s really a financial engineering move that allows the company to delay paying U.S. taxes. Apple had no long-term debt whatsoever as recently as the end of fiscal 2012 ended in September. It then piled on nearly $17 billion in fiscal 2013, added another $12 billion in fiscal 2014 and boosted debt an additional $24.5 billion in fiscal 2015.
All of our 10 ETFs in the Spotlight closed in the green as Consumer Staples (XLY) took the lead with +2.42%. With this being a risk-on day, it’s no surprise that Consumer Staples (XLP) lagged with +0.80%.
2. ETFs in the Spotlight
In case you missed the announcement and description of this section, you can read it here again.
It features 10 broadly diversified ETFs from my HighVolume list as posted every Monday. Furthermore, they are screened for the lowest MaxDD% number meaning they have been showing better resistance to temporary sell offs than all others over the past year.
Here are the 10 candidates:
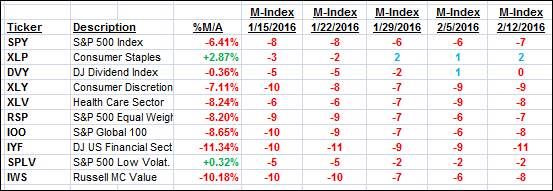
The above table simply demonstrates the magnitude with which some of the ETFs are fluctuating in regards to their positions above or below their respective individual trend lines (%M/A). A break below, represented by a negative number, shows weakness, while a break above, represented by a positive percentage, shows strength.
For hundreds of ETF/Mutual fund choices, be sure to reference Thursday’s StatSheet.
Year to date, here’s how the above candidates have fared so far:
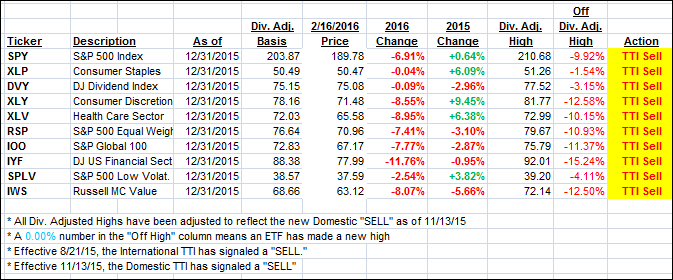
Again, the first table above shows the position of the various ETFs in relation to their respective long term trend lines (%M/A), while the second one tracks their trailing sell stops in the “Off High” column. The “Action” column will signal a “Sell” once the -7.5% point has been taken out in the “Off High” column.
3. Trend Tracking Indexes (TTIs)
Our Domestic Trend Tracking Index (TTI) improved as Friday’s exuberance enjoyed another day in the sun. I still think this is bear market bounce, and we’ll have to see if reality sets in within the next few days as economic data certainly had no positive effect on this rebound.
Here’s how we ended up:
Domestic TTI: -2.58% (last close -3.19%)—Sell signal effective 11/13/2015
International TTI: -10.65% (close -12.31%)—Sell signal effective 8/21/2015
Disclosure: I am obliged to inform you that I, as well as advisory clients of mine, own some of these listed ETFs. Furthermore, they do not represent a specific investment recommendation for you, they merely show which ETFs from the universe I track are falling within the guidelines specified.
Contact Ulli