
1. Moving the Markets
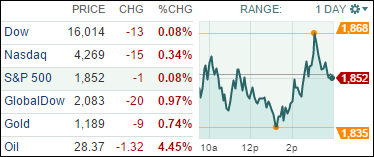
Today was repeat of yesterday’s session in that markets sold off most of the day but managed a better recovery during the last hour by closing only slightly below the unchanged line. Apparently the bulls are still alive and putting up a fight during these tug-of-war sessions.
The energy sector ended up being the worst performer, followed by telecommunications and financials. The tech sector rallied early on but lost its momentum as the FANG stocks (Facebook, Amazon, Netflix and Google) got spanked again for the second day in a row with Netflix being the only gainer for the day.
At the open, the domestic markets had to live with the fact that the Nikkei Average had lost 5.4%, its biggest decline since 2013 while the 10-year Japanese bond yield fell below zero for the first time. Much of the focus is on Asia this week (with China being closed), however, let’s not forget the banking debacle in Europe where some of the Italian banks are suffering from a constantly increasing amount of NPLs (Non Performing Loans).
Not to be outdone, Deutsche Bank (DB), the German behemoth with over $60 trillion in derivatives, is in dire straits and has been in the cross-hairs for all kinds of trouble while its stock price has dropped to records lows. Some have compared DB to having a “Lehman moment,” a reference to the firm that brought about the 2008 financial crisis.
4 of our 10 ETFs in the Spotlight ended up on the plus side, while 6 of them dropped below the unchanged line. Leading the charge was Healthcare (XLV) with +0.74% while the Global 100 (IOO) was the loser of the day with -0.71%.
2. ETFs in the Spotlight
In case you missed the announcement and description of this section, you can read it here again.
It features 10 broadly diversified ETFs from my HighVolume list as posted every Monday. Furthermore, they are screened for the lowest MaxDD% number meaning they have been showing better resistance to temporary sell offs than all others over the past year.
Here are the 10 candidates:
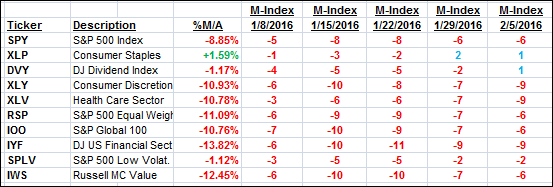
The above table simply demonstrates the magnitude with which some of the ETFs are fluctuating in regards to their positions above or below their respective individual trend lines (%M/A). A break below, represented by a negative number, shows weakness, while a break above, represented by a positive percentage, shows strength.
For hundreds of ETF/Mutual fund choices, be sure to reference Thursday’s StatSheet.
Year to date, here’s how the above candidates have fared so far:
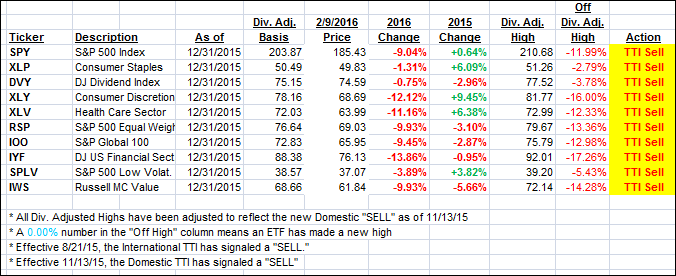
Again, the first table above shows the position of the various ETFs in relation to their respective long term trend lines (%M/A), while the second one tracks their trailing sell stops in the “Off High” column. The “Action” column will signal a “Sell” once the -7.5% point has been taken out in the “Off High” column.
3. Trend Tracking Indexes (TTIs)
Our Domestic Trend Tracking Index (TTI) harldy changed during this seesaw session.
Here’s how we closed:
Domestic TTI: -3.64% (last close -3.65%)—Sell signal effective 11/13/2015
International TTI: -13.03% (last close -12.33%)—Sell signal effective 8/21/2015
Disclosure: I am obliged to inform you that I, as well as advisory clients of mine, own some of these listed ETFs. Furthermore, they do not represent a specific investment recommendation for you, they merely show which ETFs from the universe I track are falling within the guidelines specified.
Contact Ulli