
1. Moving the Markets
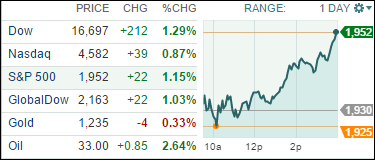
U.S. stocks shrugged off a selloff in Shanghai and were higher as Wall Street seeks to build on yesterday’s V-shape come-back that wiped out big losses and allowed stocks to finish the day up.
There was a huge sell-off of Chinese stocks overnight plunging 6%. It was the worst day of losses in a month. Investors cited fears about the economy, profit taking and liquidity. The early sell-off ins the U.S. and subsequent recovery was almost a mirror image of yesterday prompting speculation of intervention and/or continuation of last week’s short squeeze. You can read more about it here.
Restoration Hardware (RH) took a massive blow today with shares falling 25% on financial results that fell well short of expectations. The CEO cited volatile oil prices and slowed global growth as the culprits.
Wall Street was also digesting mixed economic data. The latest reading on first-time jobless claims rose 10,000 to 272,000. But January durable goods orders for long-lasting big-ticket items like refrigerators and dishwashers rose a better-than-expected 4.9%. So, not only are bad news good news, but also good news are good news. Makes you wonder how much in control the mindless computer trading algos really are.
2. ETFs in the Spotlight
In case you missed the announcement and description of this section, you can read it here again.
It features 10 broadly diversified ETFs from my HighVolume list as posted every Monday. Furthermore, they are screened for the lowest MaxDD% number meaning they have been showing better resistance to temporary sell offs than all others over the past year.
Here are the 10 candidates:
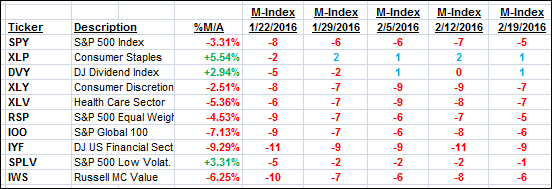
The above table simply demonstrates the magnitude with which some of the ETFs are fluctuating in regards to their positions above or below their respective individual trend lines (%M/A). A break below, represented by a negative number, shows weakness, while a break above, represented by a positive percentage, shows strength.
For hundreds of ETF/Mutual fund choices, be sure to reference Thursday’s StatSheet.
Year to date, here’s how the above candidates have fared so far:
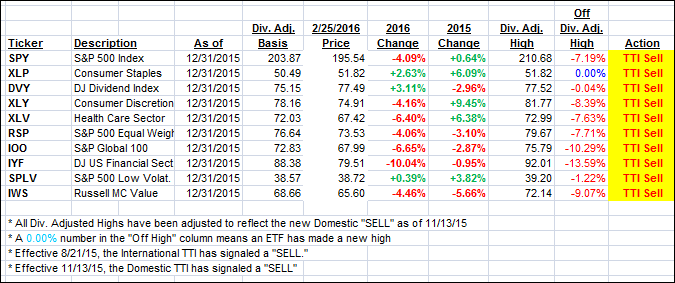
Again, the first table above shows the position of the various ETFs in relation to their respective long term trend lines (%M/A), while the second one tracks their trailing sell stops in the “Off High” column. The “Action” column will signal a “Sell” once the -7.5% point has been taken out in the “Off High” column.
3. Trend Tracking Indexes (TTIs)
Our Domestic Trend Tracking Index (TTI) headed north but clearly remains on the bearish side of its long-term trend line.
Here’s how we ended up:
Domestic TTI: -1.28% (last close -1.71%)—Sell signal effective 11/13/2015
International TTI: -8.48% (last close -9.52%)—Sell signal effective 8/21/2015
Disclosure: I am obliged to inform you that I, as well as advisory clients of mine, own some of these listed ETFs. Furthermore, they do not represent a specific investment recommendation for you, they merely show which ETFs from the universe I track are falling within the guidelines specified.
Contact Ulli