
ETF/No Load Fund Tracker StatSheet
————————————————————-
THE LINK TO OUR CURRENT ETF/MUTUAL FUND STATSHEET IS:
————————————————————
Market Commentary
EQUITIES AND CRUDE REBOUND SHARPLY BUT END UP DOWN FOR THE WEEK
1. Moving the Markets
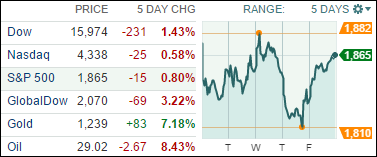
The wild ride continued on Wall Street as crude oil finally found some footing and sparked a 12% surge on Friday, which was its best session gain in 7 years. Still, for the week, oil ended up over 8% lower than it started.
Oil’s rebound pulled equities out of the basement but the rally was not sufficient to wipe out earlier losses and the indexes closed lower for the week as the chart above shows.
Powering crude oil was continued speculation that major producers are considering the “possibility” of a coordinated effort to cut crude output. Well, we’ve heard that theme before with the result that it was later denied and oil shifted sharply into reverse taking equities down with it. Maybe, this time it’s different?
All of our 10 ETFs in the Spotlight participated and closed solidly in the green for today. The leader was the Financials (IYF) with +3.54% while the Dividend ETF (DVY) showed a more modest gain of +1.14%.
2. ETFs in the Spotlight
In case you missed the announcement and description of this section, you can read it here again.
It features 10 broadly diversified ETFs from my HighVolume list as posted every Monday. Furthermore, they are screened for the lowest MaxDD% number meaning they have been showing better resistance to temporary sell offs than all others over the past year.
Here are the 10 candidates:
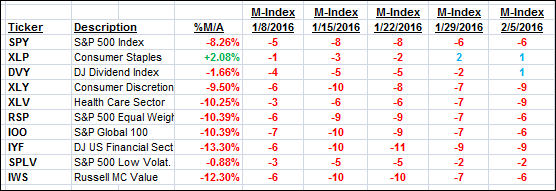
The above table simply demonstrates the magnitude with which some of the ETFs are fluctuating in regards to their positions above or below their respective individual trend lines (%M/A). A break below, represented by a negative number, shows weakness, while a break above, represented by a positive percentage, shows strength.
For hundreds of ETF/Mutual fund choices, be sure to reference Thursday’s StatSheet.
Year to date, here’s how the above candidates have fared so far:
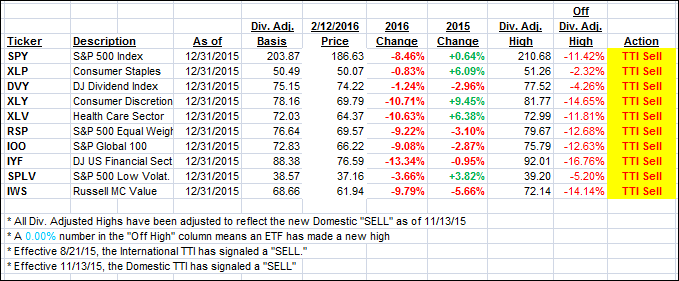
Again, the first table above shows the position of the various ETFs in relation to their respective long term trend lines (%M/A), while the second one tracks their trailing sell stops in the “Off High” column. The “Action” column will signal a “Sell” once the -7.5% point has been taken out in the “Off High” column.
3. Trend Tracking Indexes (TTIs)
Our Domestic Trend Tracking Index (TTI) slipped at tad this week and remains firmly entrenched on the bearish side of its trend line.
Here’s how we closed this week:
Domestic TTI: -3.19% (last Friday -3.24%)—Sell signal effective 11/13/2015
International TTI: -12.31% (last Friday -10.63%)—Sell signal effective 8/21/2015
Have a great weekend.
Ulli…
Disclosure: I am obliged to inform you that I, as well as advisory clients of mine, own some of these listed ETFs. Furthermore, they do not represent a specific investment recommendation for you, they merely show which ETFs from the universe I track are falling within the guidelines specified.
————————————————————-
READER Q & A FOR THE WEEK
All Reader Q & A’s are listed at our web site!
Check it out at:
https://theetfbully.com/questions-answers/
———————————————————-
WOULD YOU LIKE TO HAVE YOUR INVESTMENTS PROFESSIONALLY MANAGED?
Do you have the time to follow our investment plans yourself? If you are a busy professional who would like to have his portfolio managed using our methodology, please contact me directly or get more details at:
https://theetfbully.com/personal-investment-management/
———————————————————
Back issues of the ETF/No Load Fund Tracker are available on the web at:
https://theetfbully.com/newsletter-archives/
Contact Ulli