1. Moving the Markets
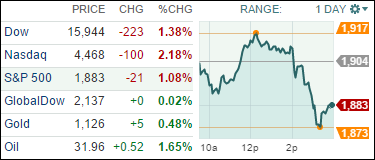
Stocks dove sharply into negative territory after the Federal Reserve signaled that it has not ruled out another interest rate hike at its March meeting despite noting that it is “closely monitoring” recent turbulence in financial markets and the global economy.
All major indexes fell at least 1.1% today, with the Nasdaq posting a striking 2.18% loss.
Wall Street had been hoping the Fed would use its post-meeting January policy statement to send a different message: that it would, in effect, dial back the prospect for a rate hike at its March meeting and lower the likelihood of four quarter-point hikes in total for the year. But the Fed didn’t go that far or wasn’t “dovish” enough, disappointing investors who responded by dumping stocks as the question marks related to Fed policy remained open.
In earnings news, Facebook (FB) shares just shot up 8% in after-hours trading after the giant social network said it earned 79 cents a share on revenue of $5.84 billion in Q4 2015, easily topping Wall Street estimates of 69 cents a share. Facebook is grabbing a larger share of a growing digital advertising market. Facebook will capture $9.86 billion in U.S. display ad revenue in 2016 for a 30.6% share of total spending in that market, says research firm eMarketer.
In airlines, we heard today that Boeing Co. (BA) reported $1 billion in Q4 2015 earnings, a 30% drop from a year earlier, due to sluggishness in the air cargo market. The company said it expects 2016 core earnings between $8.15 a share and $8.35 a share. Analysts were expecting $9.41 a share. The company’s stock closed down 9% to $116.58 a share.
All of our 10 ETFs in the Spotlight headed south after a 2-day bounce and closed in the red led by Consumer Discretionaries (XLY) with -1.56%. Resisting the sell-off the best was Consumer Staples (XLP) with a modest loss of -0.10%.
2. ETFs in the Spotlight
In case you missed the announcement and description of this section, you can read it here again.
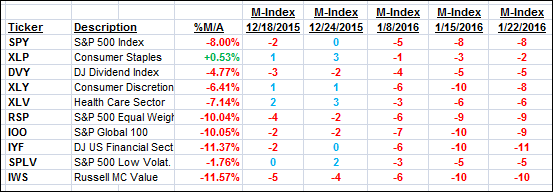
It features 10 broadly diversified ETFs from my HighVolume list as posted every Monday. Furthermore, they are screened for the lowest MaxDD% number meaning they have been showing better resistance to temporary sell offs than all others over the past year.
Here are the 10 candidates:

The above table simply demonstrates the magnitude with which some of the ETFs are fluctuating in regards to their positions above or below their respective individual trend lines (%M/A). A break below, represented by a negative number, shows weakness, while a break above, represented by a positive percentage, shows strength.
For hundreds of ETF/Mutual fund choices, be sure to reference Thursday’s StatSheet.
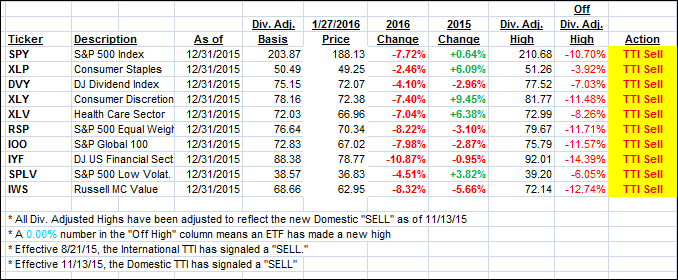
Year to date, here’s how the above candidates have fared so far:

Again, the first table above shows the position of the various ETFs in relation to their respective long term trend lines (%M/A), while the second one tracks their trailing sell stops in the “Off High” column. The “Action” column will signal a “Sell” once the -7.5% point has been taken out in the “Off High” column.
3. Trend Tracking Indexes (TTIs)
Our Domestic Trend Tracking Index (TTI) dropped deeper into bearish territory as the 2-day dead cat bounce in the markets came to an end with the major indexes staging a sharp intra-day reversal.
Here’s how we ended up after a wild roller-coaster day:
Domestic TTI: -3.38% (last close -2.85%)—Sell signal effective 11/13/2015
International TTI: -10.67% (last close -10.37%)—Sell signal effective 8/21/2015
Disclosure: I am obliged to inform you that I, as well as advisory clients of mine, own some of these listed ETFs. Furthermore, they do not represent a specific investment recommendation for you, they merely show which ETFs from the universe I track are falling within the guidelines specified.
Contact Ulli