
1. Moving the Markets
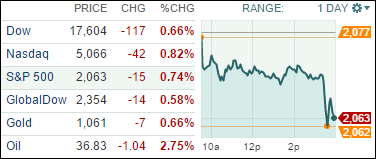
Stocks fell Wednesday, with losses accelerating towards the closing bell. This is the next-to-last day of trading in 2015, which has turned out to be a disappointing year for investors that have seen stocks trade sideways and post flat return for the most part. After today’s trading session, the S&P 500 is up just 0.2% for the year and the Dow is negative 1.2%. The shining light has been the Nasdaq, which is up nearly 8% for 2015.
What hurt stocks today is the same thing that has plagued the markets all year: falling oil prices due to oversupply. U.S.-produced crude dropped about 2.8% and closed at $36.81 a barrel. The reason being there was a report that showed another rise in U.S. inventory counts, according to the Energy Information Administration.
If you didn’t know, Intel (INTC) finally closed the $16.7 billion deal to buy chip maker Altera on Monday, which is Intel’s largest acquisition to date. The stock traded well yesterday, but took a hit today alongside the majority of the market. In a press release today, a spokesperson for Intel said the company estimates that Altera will contribute about $1.76 billion revenue to Intel’s Data Center Group segment in 2016.
All of our 10 ETFs in the Spotlight reversed and headed lower as oil’s jump yesterday proved to be a dead cat bounce. The Global 100 (IOO) led to the downside with a loss of -0.94%, while Consumer Staples (XLP) held up best by giving back only -0.35%.
2. ETFs in the Spotlight
In case you missed the announcement and description of this section, you can read it here again.
It features 10 broadly diversified ETFs from my HighVolume list as posted every Monday. Furthermore, they are screened for the lowest MaxDD% number meaning they have been showing better resistance to temporary sell offs than all others over the past year.
Here are the 10 candidates:
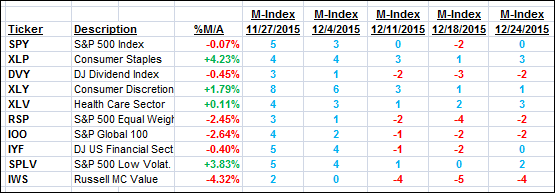
The above table simply demonstrates the magnitude with which some of the ETFs are fluctuating in regards to their positions above or below their respective individual trend lines (%M/A). A break below, represented by a negative number, shows weakness, while a break above, represented by a positive percentage, shows strength.
For hundreds of ETF/Mutual fund choices, be sure to reference Thursday’s StatSheet.
Year to date, here’s how the above candidates have fared so far:
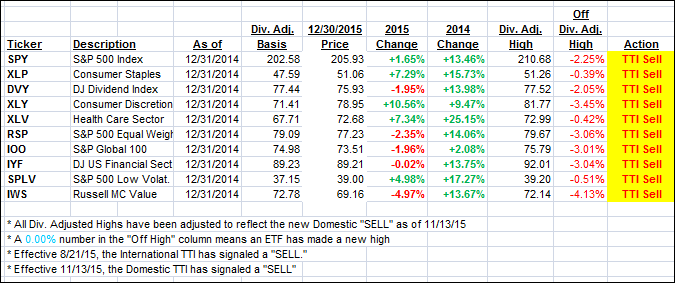
Again, the first table above shows the position of the various ETFs in relation to their respective long term trend lines (%M/A), while the second one tracks their trailing sell stops in the “Off High” column. The “Action” column will signal a “Sell” once the -7.5% point has been taken out in the “Off High” column.
3. Trend Tracking Indexes (TTIs)
Our Domestic Trend Tracking Index (TTI) slipped and headed south moving further away from a potential trend line break to the upside. The markets remain stuck in a broad trading range unable to make headway in either direction.
Here’s how we closed:
Domestic TTI: -0.32% (last close -0.02%)—Sell signal effective 11/13/2015
International TTI: -3.71% (last close -3.20%)—Sell signal effective 8/21/2015
Disclosure: I am obliged to inform you that I, as well as advisory clients of mine, own some of these listed ETFs. Furthermore, they do not represent a specific investment recommendation for you, they merely show which ETFs from the universe I track are falling within the guidelines specified.
Contact Ulli