
1. Moving the Markets
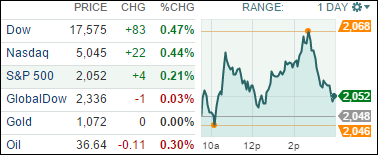
Stocks rose as Wall Street halted a three-day downturn despite another drop in oil prices. We have been confronting a variety of issues this week including plunging oil prices, global economic pressures and the likelihood that the Fed will begin raising interest rates for the first time in almost a decade at its meeting next week. Economic reports that have come in over the past two months have led Fed Chair Janet Yellen to (unofficially) signal that the time is near to raise rates, which have been near zero since the financial crisis of 2008.
Things are not looking up for the oil and natural gas industry. U.S. Crude fell again today to close at $36.56 a barrel. In addition, we heard news that Freeport-McMoRan (FCX) said that it would be suspending its common stock dividend, reducing some production and revising its oil and gas capital spending strategy in response to market conditions. The Phoenix based natural resources company, which is the largest publicly-traded copper producer in the world, had already announced that it would put off investments in some long term projects.
We heard some interesting news from Walmart (WMT) today. The company is removing the need to get your wallet out at the register with a new digital payment method called Walmart Pay. The technology piece launched today in Bentonville, AK (Walmart’s headquarter city). The feature allows customers to pay for purchases in stores by scanning a QR code displayed at the register with their smartphone, instead of swiping or inserting a card at the payment terminal. Customers can store any payment method — credit card, debit card, prepaid card or gift card — in the Walmart Pay function within the Walmart app.
8 of our 10 ETFs in the Spotlight gained on today’s modest rebound with the leader being
Healthcare (XLV), which added +0.75%. On the downside, the Select Dividend ETF (DVY) lost -0.36%.
2. ETFs in the Spotlight
In case you missed the announcement and description of this section, you can read it here again.
It features 10 broadly diversified ETFs from my HighVolume list as posted every Monday. Furthermore, they are screened for the lowest MaxDD% number meaning they have been showing better resistance to temporary sell offs than all others over the past year.
Here are the 10 candidates:
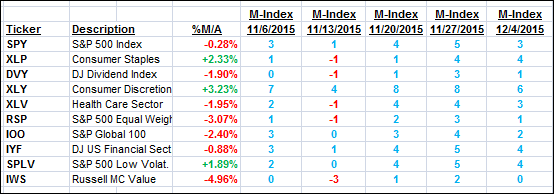
The above table simply demonstrates the magnitude with which some of the ETFs are fluctuating in regards to their positions above or below their respective individual trend lines (%M/A). A break below, represented by a negative number, shows weakness, while a break above, represented by a positive percentage, shows strength.
For hundreds of ETF/Mutual fund choices, be sure to reference Thursday’s StatSheet.
Year to date, here’s how the above candidates have fared so far:
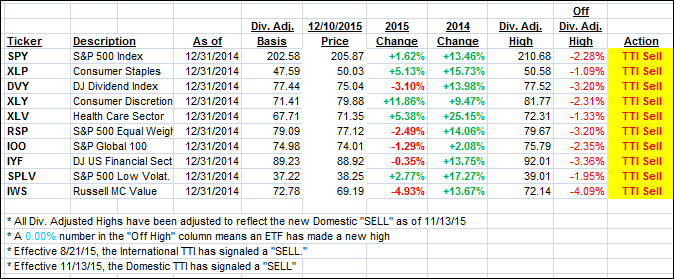
Again, the first table above shows the position of the various ETFs in relation to their respective long term trend lines (%M/A), while the second one tracks their trailing sell stops in the “Off High” column. The “Action” column will signal a “Sell” once the -7.5% point has been taken out in the “Off High” column.
3. Trend Tracking Indexes (TTIs)
Our Domestic Trend Tracking Index (TTI) remained on the bearish side of its trend line by the following percentage:
Domestic TTI: -0.38% (last close -0.47%)—Sell signal effective 11/13/2015
International TTI: -4.57% (last close -4.64%)—Sell signal effective 8/21/2015
Disclosure: I am obliged to inform you that I, as well as advisory clients of mine, own some of these listed ETFs. Furthermore, they do not represent a specific investment recommendation for you, they merely show which ETFs from the universe I track are falling within the guidelines specified.
Contact Ulli